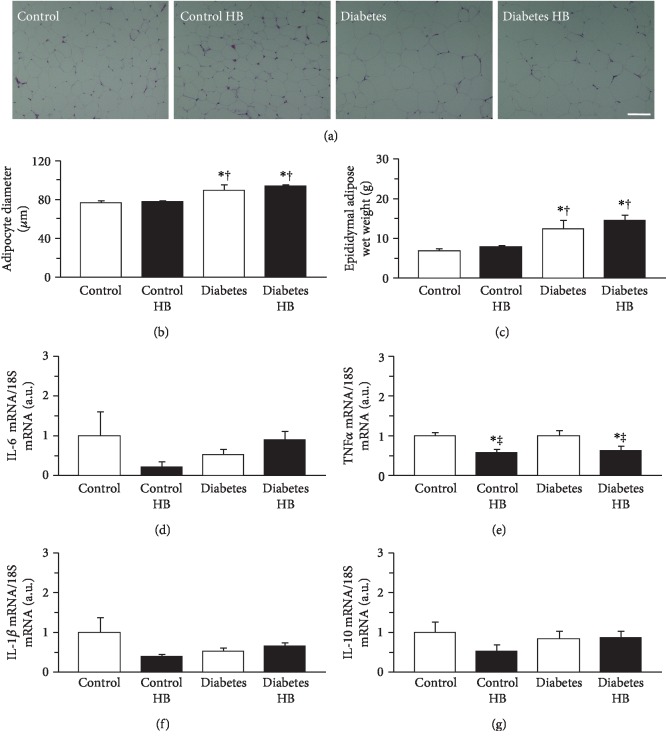
Figure 2.
Adipocyte size, adipose tissue mass, and cytokine expression in adipose tissue. Representative sections of epididymal adipose tissue stained with hematoxylin and eosin (a), adipocyte diameter (b), wet weight of adipose tissue (c), expression levels of IL-6 mRNA (d), TNFα mRNA (e), IL-1β mRNA (f), and IL-10 mRNA (g). Control: nontreated control group; Control HB: control treated with the hyperbaric normoxia group; Diabetes: nontreated diabetes group; Diabetes HB: diabetes treated with the hyperbaric normoxia group. Bar = 100 μm. Values are means ± standard deviation. IL-6, TNFα, IL-1β, and IL-10 mRNA expression levels were calculated as fold changes relative to the Control group. ∗,†,‡Significantly different from the Control, Control HB, and Diabetes groups, p < 0.05, respectively.

