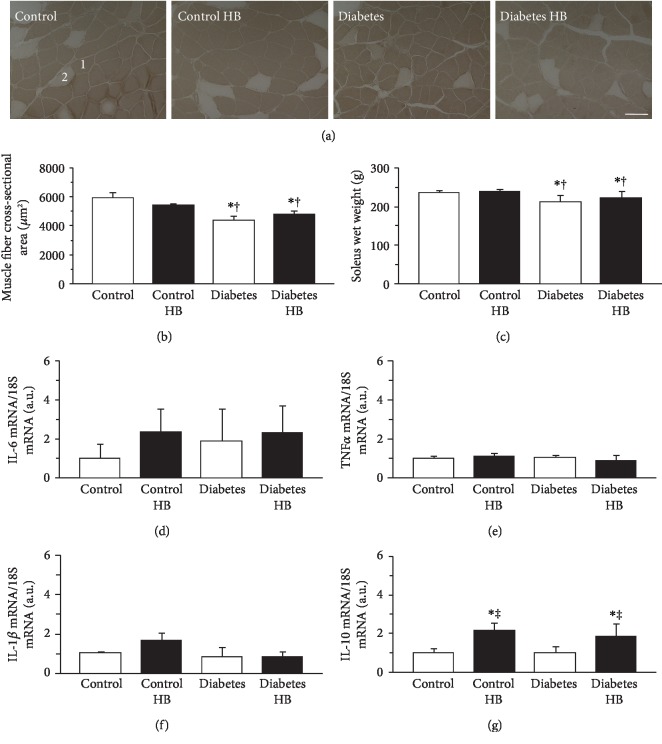
Figure 4.
Muscle fiber cross-sectional area, wet weight, and cytokine expression in the soleus muscle. Representative sections of the soleus muscle stained for ATPase activity (a), type I fiber cross-sectional area (b), wet weight (c), expression levels of IL-6 mRNA (d), TNFα mRNA (e), IL-1β mRNA (f), and IL-10 mRNA (g). Control: nontreated control group; Control HB: control treated with the hyperbaric normoxia group; Diabetes: nontreated diabetes group; Diabetes HB: diabetes treated with the hyperbaric normoxia group; 1: type I fiber; 2: type IIA fiber. Bar = 100 μm. Values are means ± standard deviation. IL-6, TNFα, IL-1β, and IL-10 mRNA expression levels were calculated as fold changes relative to the Control group. ∗,†,‡Significantly different from the Control, Control HB, and Diabetes groups, p < 0.05, respectively.

