
Figure 5.
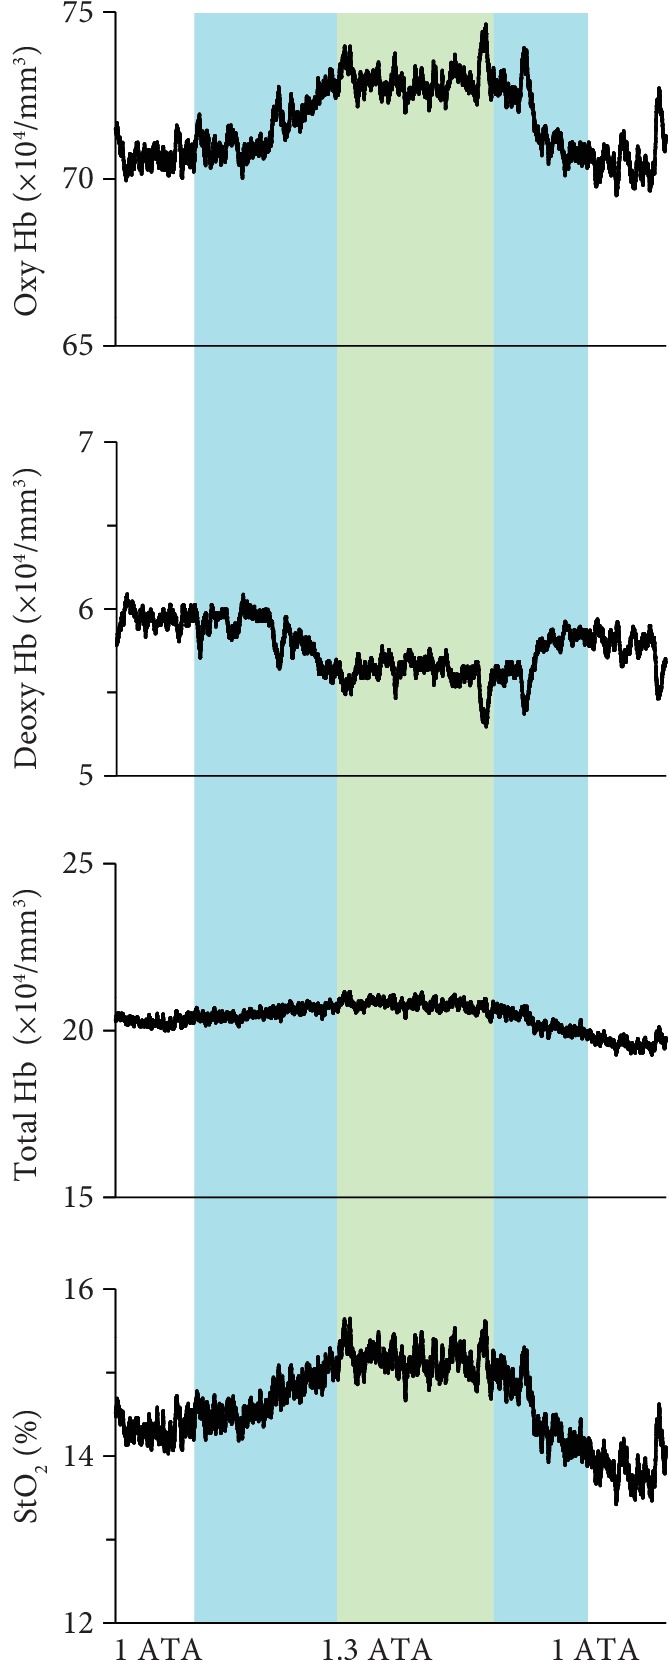
Representative NIRS data for calf muscles during hyperbaric treatment. The green area indicates 1.3 ATA, and blue areas indicate early compression and late decompression periods. Each variable was sequentially calculated every 0.1 s.
Official websites use .gov
A
.gov website belongs to an official
government organization in the United States.
Secure .gov websites use HTTPS
A lock (
) or https:// means you've safely
connected to the .gov website. Share sensitive
information only on official, secure websites.
Representative NIRS data for calf muscles during hyperbaric treatment. The green area indicates 1.3 ATA, and blue areas indicate early compression and late decompression periods. Each variable was sequentially calculated every 0.1 s.