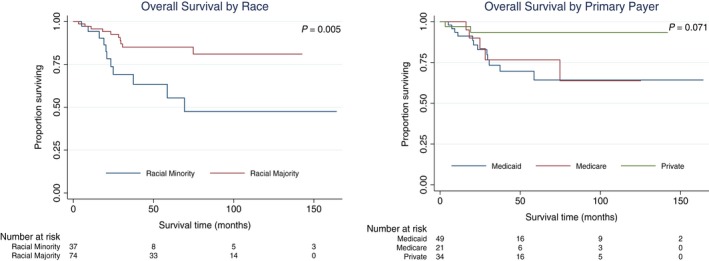
Figure 2.

OS in ASCC by SES. Survival curves were created in STATA software version 15 using the Kaplan‐Meier method with the log‐rank test for significance. Only variables significant at P < .05 in log‐rank test or Cox proportional hazards regression are shown. ASCC, anal squamous cell carcinoma; OS, overall survival; SES, socioeconomic status
