
Figure 5.
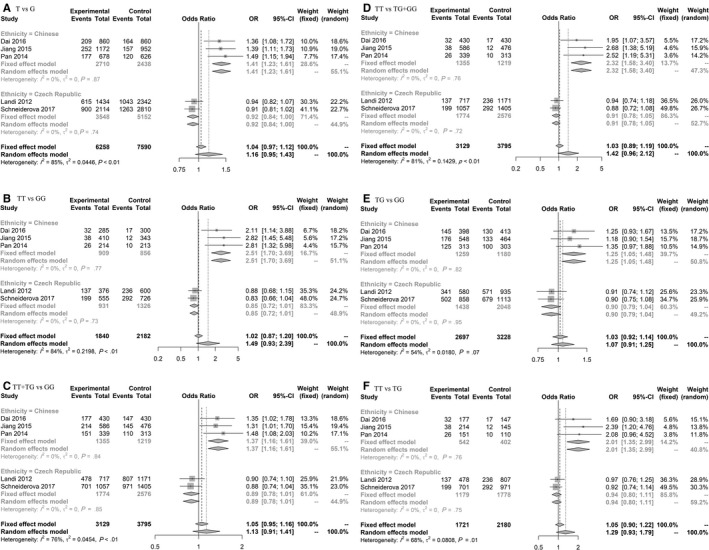
Forest plot related to rs712 and risk of CRC. A, Allelic model. B, Homozygote model. C, Dominant model. D, Recessive model. E, Heterozygote model. F, TT vs TG model
Official websites use .gov
A
.gov website belongs to an official
government organization in the United States.
Secure .gov websites use HTTPS
A lock (
) or https:// means you've safely
connected to the .gov website. Share sensitive
information only on official, secure websites.
Forest plot related to rs712 and risk of CRC. A, Allelic model. B, Homozygote model. C, Dominant model. D, Recessive model. E, Heterozygote model. F, TT vs TG model