
Figure 2.
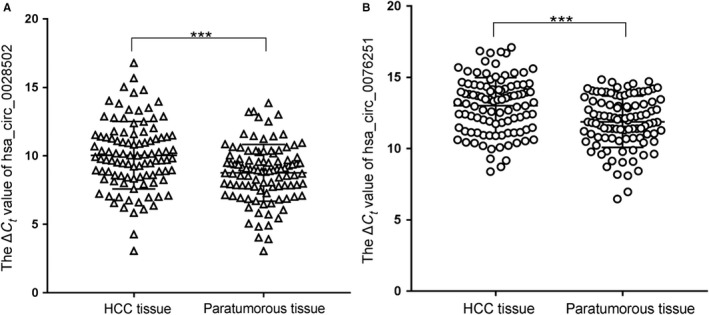
Hsa_circ_0028502 and hsa_circ_0076251 expression features in HCC tissues. A, Hsa_circ_0028502 levels in 100 HCC tissues and their matched adjacent nontumorous tissues were detected using qRT‐PCR method. B, Hsa_circ_0076251 levels in 100 HCC tissues and their matched adjacent nontumorous tissues were detected using qRT‐PCR method. Larger ΔCt value indicates lower expression. Data are means ± SD. ***P<.001