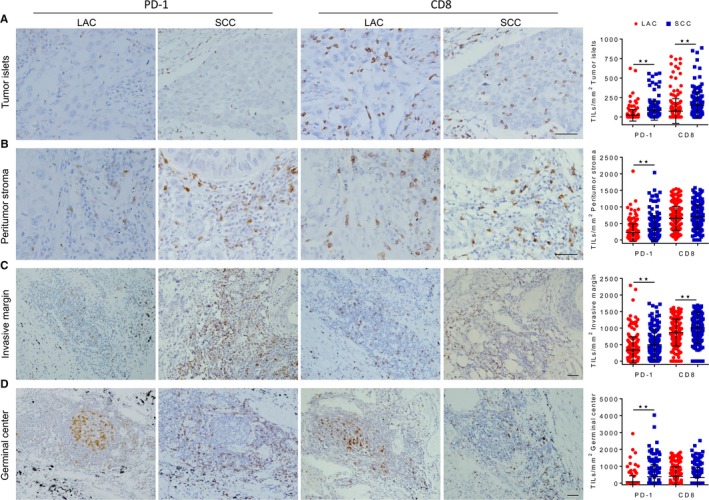
Figure 1.

Distribution of programmed cell death 1 (PD‐1) and CD8 tumor‐infiltrating lymphocytes (TIL) in lung adenocarcinoma (LAC) and squamous cell carcinoma (SCC) samples. Representative images of immunohistochemical staining showing the distribution of PD‐1 and CD8 TIL, and dot plot diagrams comparing the density of PD‐1+ cells and CD8+ T cells in the tumor islets (A), peritumoral stroma (B), invasive margin (C), and germinal center (D) of LAC and SCC samples. **P < .01. t test. Scale bar, 50 µm
