
Figure 1.
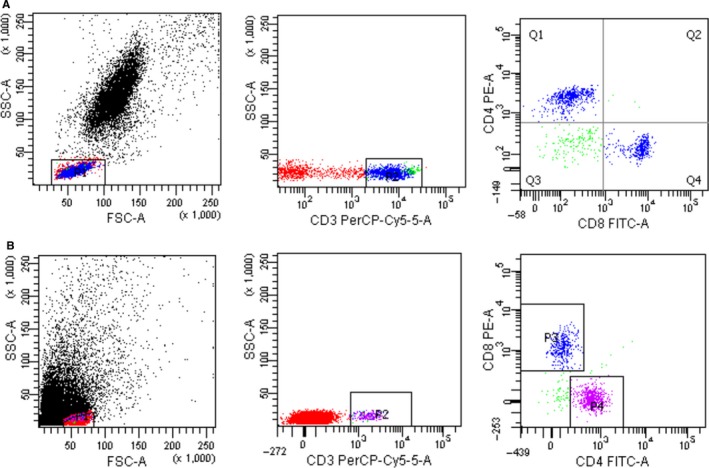
Flow cytometry plots of peripheral and tumor‐infiltrating CD4 + and CD8 + T cells. (A) peripheral blood CD4 + T cells and CD8 + T cells; (B) tumor‐infiltrating CD4 + T cells and CD8 + T cells
Official websites use .gov
A
.gov website belongs to an official
government organization in the United States.
Secure .gov websites use HTTPS
A lock (
) or https:// means you've safely
connected to the .gov website. Share sensitive
information only on official, secure websites.
Flow cytometry plots of peripheral and tumor‐infiltrating CD4 + and CD8 + T cells. (A) peripheral blood CD4 + T cells and CD8 + T cells; (B) tumor‐infiltrating CD4 + T cells and CD8 + T cells