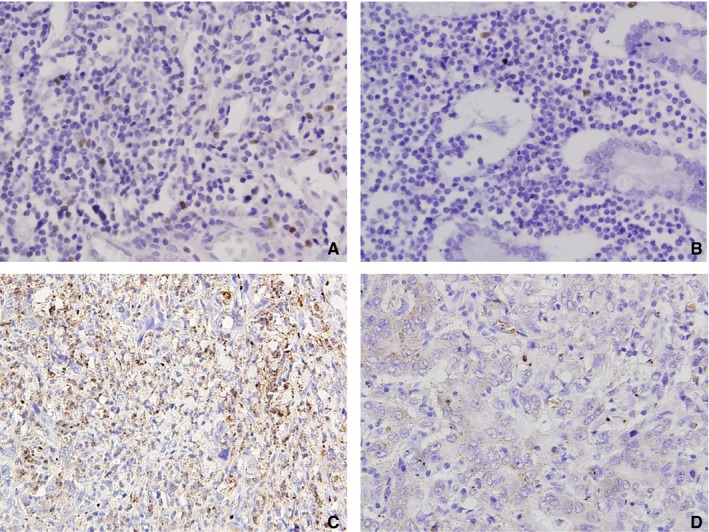
Figure 3.

Immunohistochemical staining for Foxp3 + Treg and IDO expression in gastric cancer tissues (×400): (A) Foxp3 + Treg was high (positive cell staining index = 2.9%); (B) Foxp3 + Treg was low (positive cell staining index = 0.2%). (C) IDO expression was positive. (D) IDO expression was negative
