Figure 3.

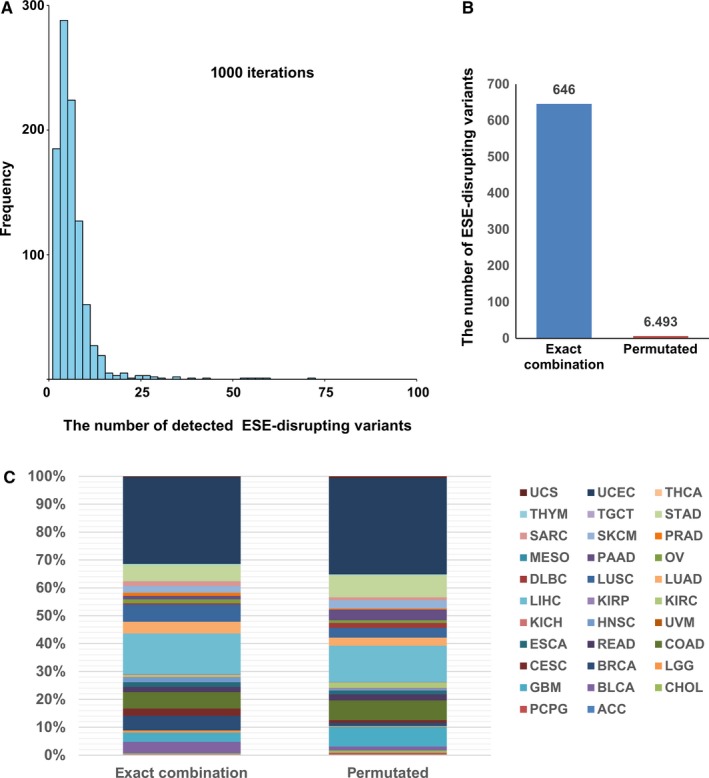
Permutation test. A, Distribution of number of ESE‐disrupting variants obtained after the permutation test. B, Numbers of ESE‐disrupting variants detected in exact combination and permutated combinations. The number of permutated combinations is an average of 1000 combinations. C, Details of ESE‐disrupting variants detected in each TCGA project
