
Figure 5.
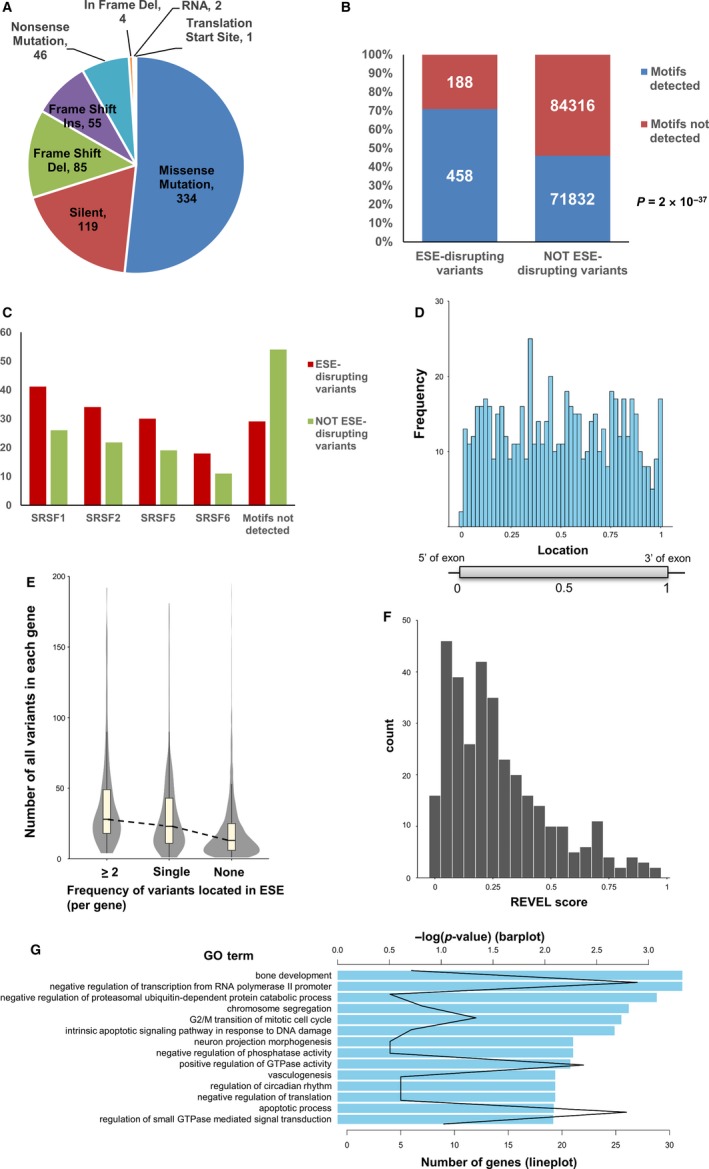
Characteristics of identified ESE‐disrupting variants. A, Details of variant types of ESE‐disrupting variants identified. B, Numbers of somatic variants located in four known SR protein (SRSF1, SRSF2, SRSF5, SRSF6) binding motifs, identified by ESE finder. P‐value was calculated using a hypergeometric distribution. C, Percentages of variants located in SR protein binding motifs identified by ESE finder. D, Positional distribution of identified ESE‐disrupting variants in exons. The X‐axis indicates the normalized position of each exon; 0 indicates the 5ʹ end of the exon and 1 indicates the 3ʹ end of the exon. E, Distributions of the number of total somatic variants in each gene. Genes were classified into three groups: more than two ESE‐disrupting variants detected, one ESE‐disrupting variant detected, and no ESE‐disrupting variants detected. F, REVEL score distribution of identified ESE‐disrupting variants. The X‐axis indicates the REVEL score. G, Results of GO enrichment analysis using genes harboring ESE‐disrupting variants. The bar plot indicates the log10 converted P‐value for each GO term. The line plot indicates the number of genes associated with each GO term