
Figure 6.
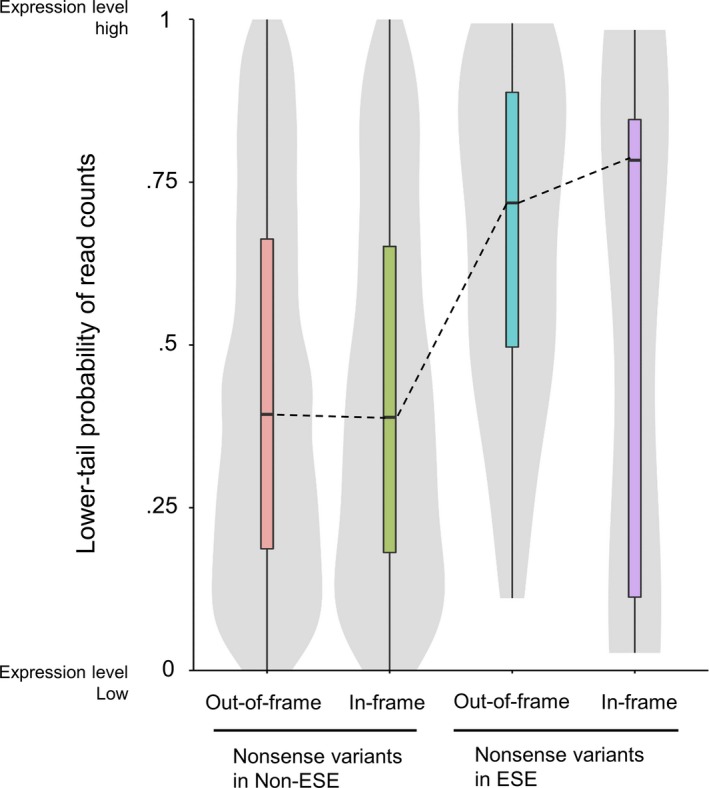
Expression levels of genes harboring nonsense variants. The Y‐axis shows a lower‐tail probability of read counts of genes harboring ESE‐disrupting nonsense variants to the read count distributions of samples without nonsense variants. This value can range from 0 to 1, with a larger value indicating higher expression levels. Genes were classified into four groups: out‐of‐frame variants in non‐ESE, in‐frame variants in non‐ESE, out‐of‐frame variants in ESE and in‐frame variants in ESE