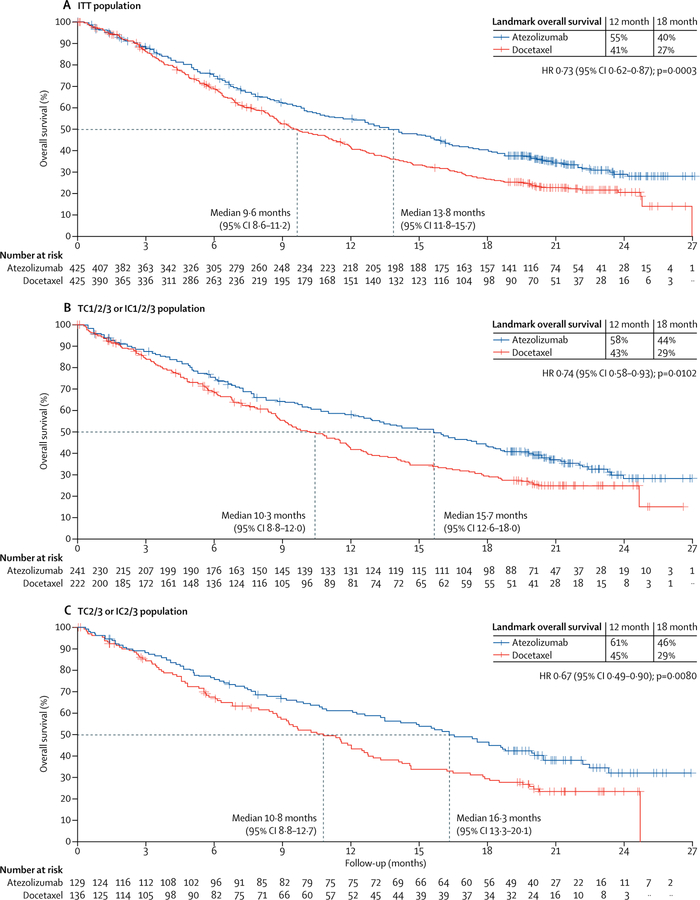
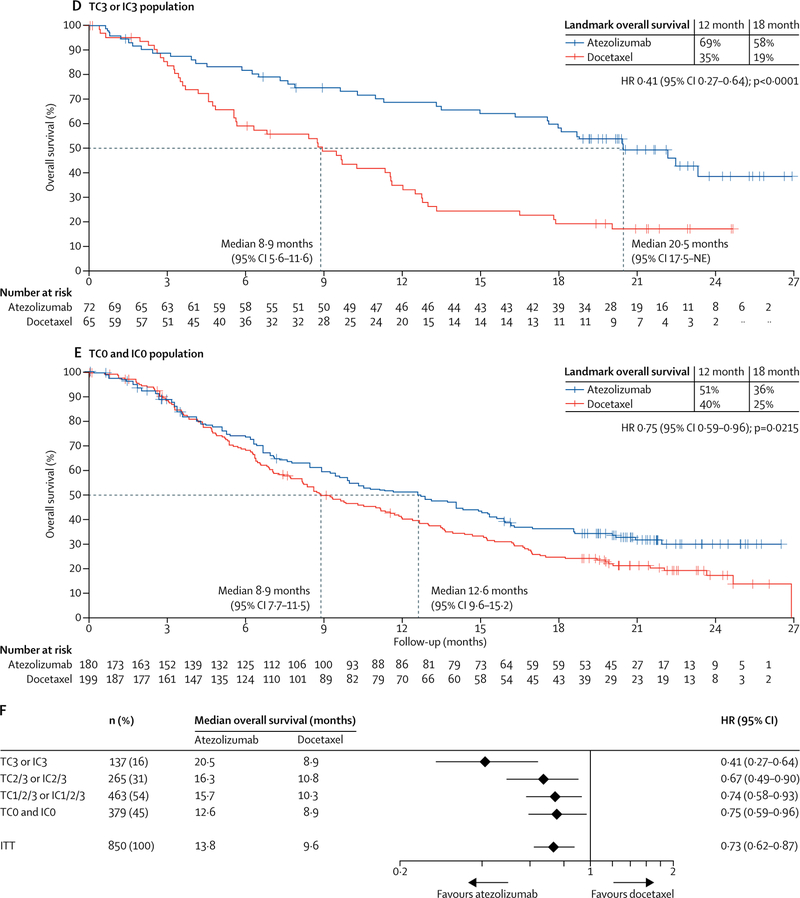
Figure 2: Overall survival in the ITT population and PD-L1 subgroups.
(A) Kaplan-Meier estimates in the ITT primary population, stratified according to PD-L1 expression on tumour-infiltrating immune cells (IC0 vs IC1 vs IC2 vs IC3), the number of previous chemotherapy regimens (one vs two), and histology (non-squamous vs squamous). (B) Kaplan-Meier estimates in theTC1/2/3 or IC1/2/3 group with the same strata. (C) Kaplan-Meier estimates in the TC2/3 or IC2/3 group (unstratified). (D) Kaplan-Meier estimates in the TC3 or IC3 group (unstratified). (E) Kaplan-Meier estimates in the TC0 and IC0 group (unstratified). (F) HRs for overall survival in PD-L1 subgroups. Median overall survival was estimated by Kaplan-Meier analysis. HR=hazard ratio. IC=tumour-infiltrating immune cells. ITT=intention-to-treat. NE=not evaluable. PD-L1=programmed death-ligand 1. TC=tumour cells.


