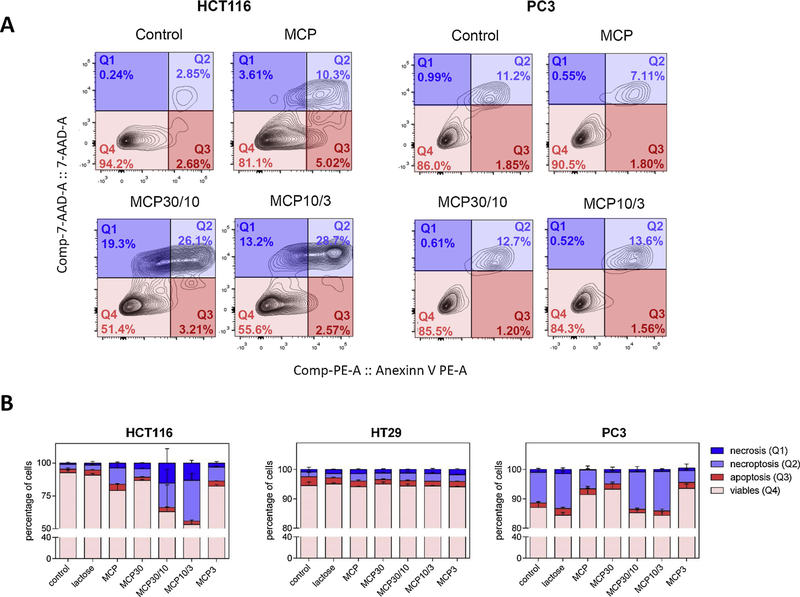
Fig. 4.
Effects of MCP and MCP fractions in HCT116, HT29 and PC3 apoptosis by flow cytometry. Cancer cells were induced to late apoptosis/necroptosis after MCP and MCP fractions treatment for 24 h. A) Q1: necrosis quadrant; Q2: necroptosis quadrant; Q3: apoptopsis quadrant; Q4: viable cells quadrant. The most significant differences in graphics are shown in the figure (HCT116 and PC3 cells treatment). B) The results were expressed in percentage of cells in comparison with control (no treatment). Results were represented as mean ± SD of two independent experiments, with each performed in triplicate.

