Fig. 1.

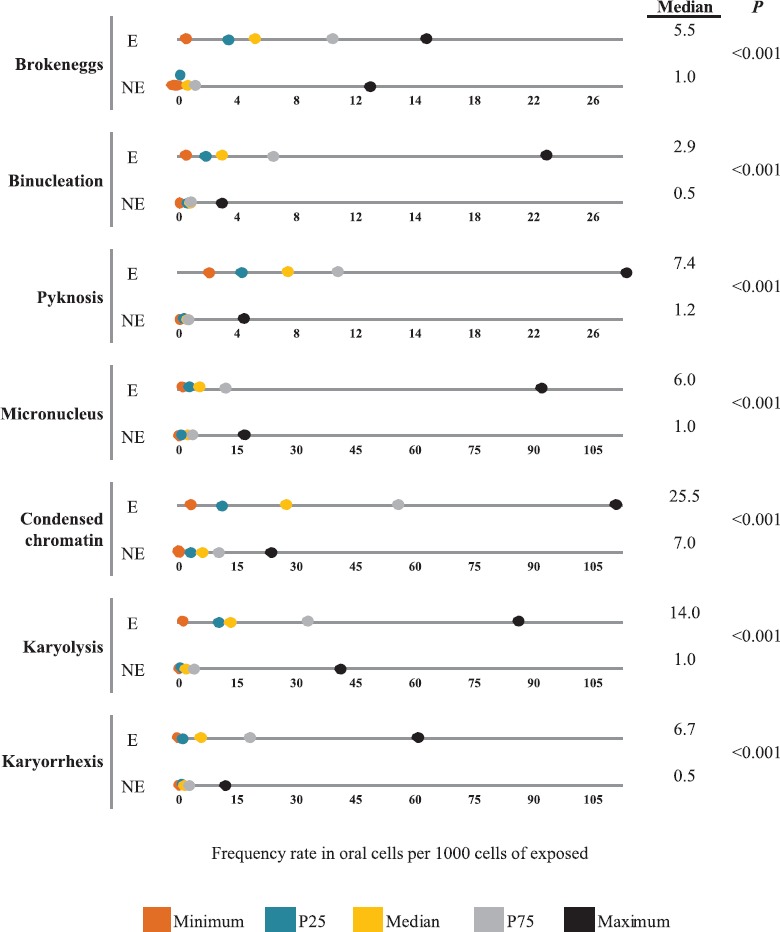
Anomaly rate in oral cells per 1000 cells of exposed (E) (n=43) and not exposed (NE) (n=41). P25, 25th percentile; P75, 75th percentile.

Anomaly rate in oral cells per 1000 cells of exposed (E) (n=43) and not exposed (NE) (n=41). P25, 25th percentile; P75, 75th percentile.