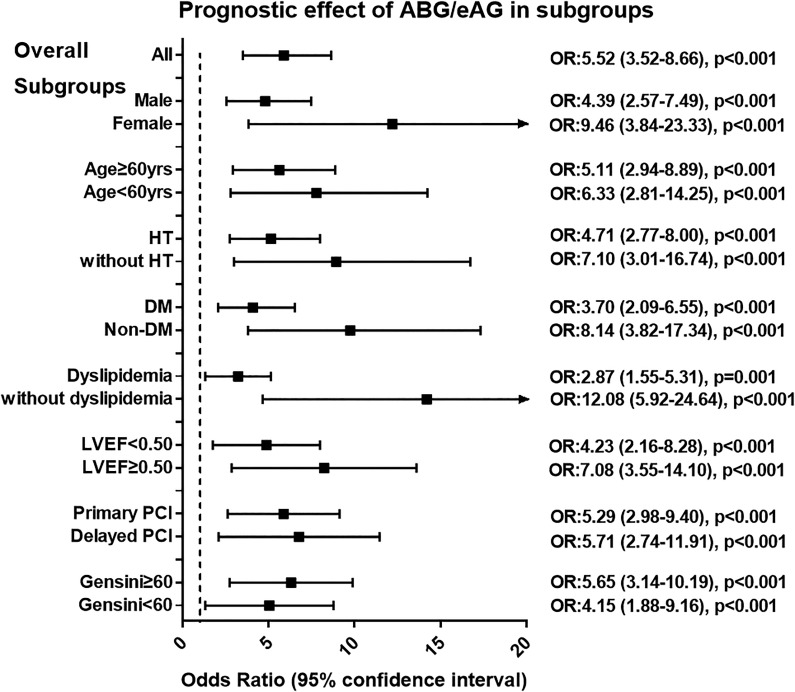
Figure 2.
Relationship between ABG/eAG level and the risk of composite end point in overall and in subgroups of patients. Patients were stratified by sex, age, hypertension, diabetes, dyslipidemia, LVEF level, PCI timing, and the Gensini score. Odds ratio (OR) was calculated by the univariate logistic regression analysis. Odds ratio for per 1 standard deviation increased in ABG/eAG. Vertical dotted line indicated the OR value of 1. ABG indicates admission blood glucose; DM, diabetes; eAG, estimated average glucose; HT, hypertension; LVEF, left ventricular ejection fraction; PCI, percutaneous coronary intervention.

