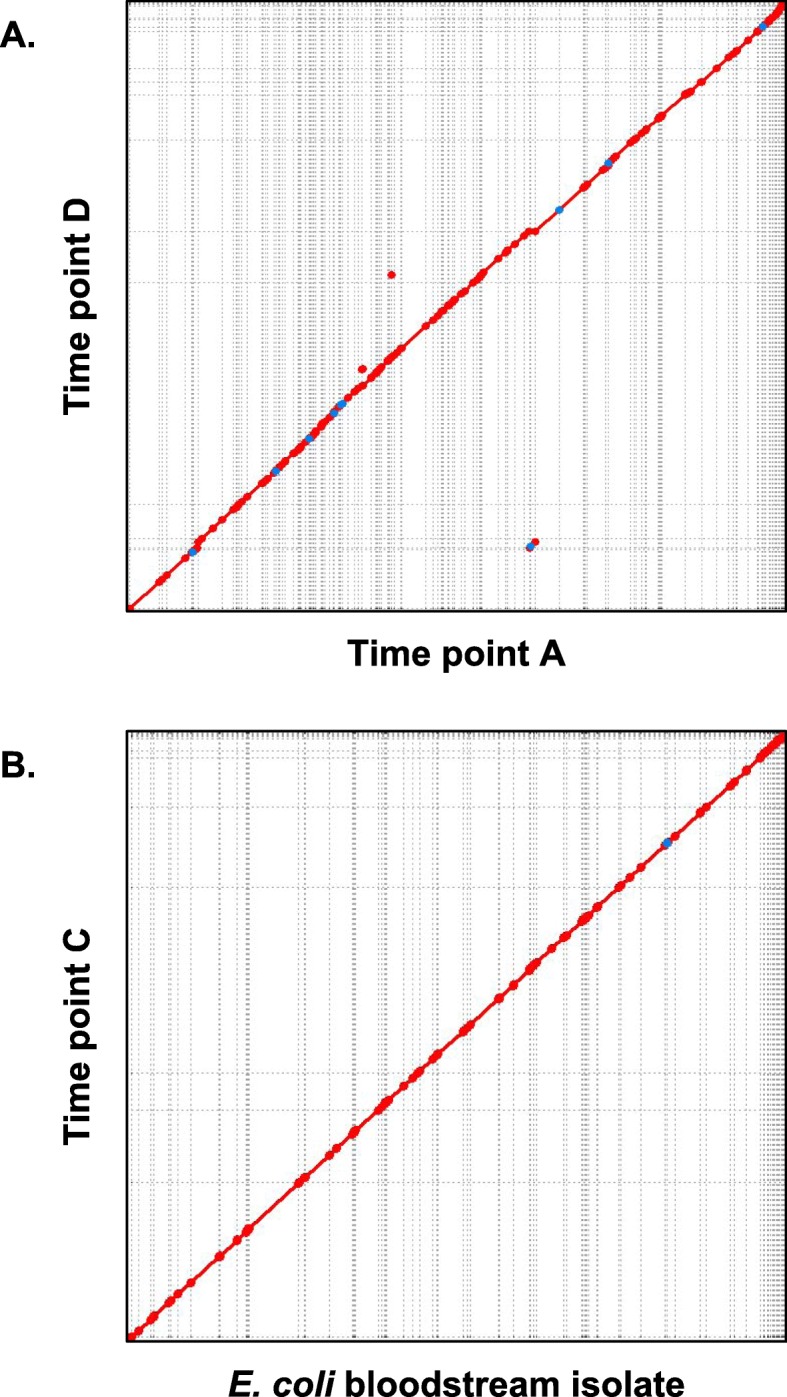
Fig. 4.

Syntenic dotplots comparing E. coli strains across time points and between the intestine and the bloodstream. Regions of sequence identity are marked by colored lines. A Sample A draft genome (x-axis) compared to sample D draft genome (y-axis). B Bloodstream isolate genome (x-axis) compared to sample C draft genome (y-axis). The near-perfect correspondence reveals that the bloodstream isolate is concordant with and thus likely originated from the intestinal microbiome
