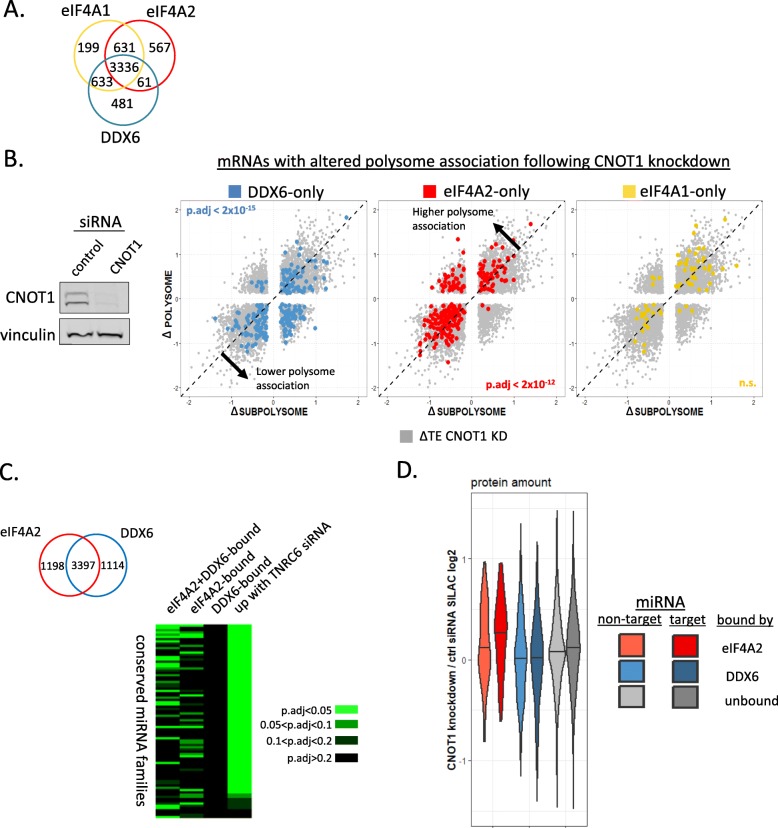
Fig. 5.
Different miRNA families target mRNAs bound by eIF4A2 alone or eIF4A2 and DDX6. a Venn diagram showing numbers of mRNAs enriched in RIP-Seq of eIF4A1, eIF4A2, and DDX6. b Depletion of CNOT1 shifts mRNAs bound by eIF4A2 into polysomes and mRNAs bound by DDX6 alone out of polysomes, while eIF4A1-bound mRNAs do not show a consistent shift. RNA-Seq experiment n = 4. Significance was calculated using the Dunn test with the Benjamini-Hochberg correction. Western blot shows a representative CNOT1 knockdown experiment confirming efficient knockdown with vinculin as loading control. c Venn diagram shows numbers of mRNAs enriched in RIP-Seq when only considering eIF4A2 and DDX6. mRNAs bound by eIF4A2, DDX6, or both (eIF4A2 + DDX6) as well as mRNAs upregulated following TNRC6A/B knockdown in HEK293 cells (FDR < 0.05) were categorized according to target prediction for conserved miRNA families (Targetscan [61]). Enrichment of mRNAs targeted by a particular miRNA family (for full list of families, see Additional file 2: Table S1) in each group was assessed using Fisher’s exact test. Heatmap presents enrichment below an adjusted p value (FDR) of 0.05, as well as between 0.05 and 0.1 and between 0.1 and 0.2, to show consistency even with lower stringency cutoffs. d Pulsed SILAC labeling for 14 h was performed following 34 h of CNOT1 or control knockdown. Violin plot shows ratios of labeled proteins for proteins encoded by mRNAs bound by indicated proteins. Each group was divided into miRNA “target” and “non-target” as assessed by up- or downregulation following TNRC6A/B knockdown

