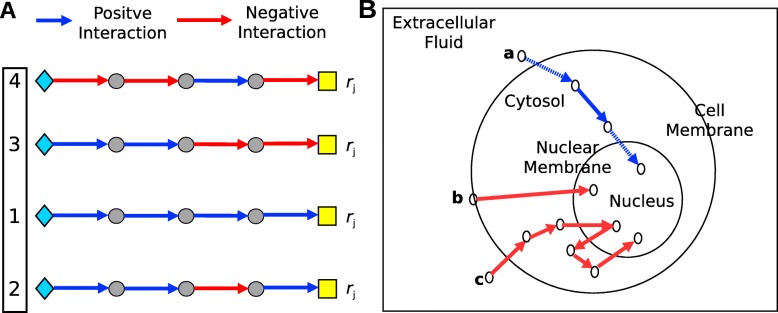
Fig. 2.
a Illustration of four PathLinker paths from receptors (diamonds) to transcriptional regulators (yellow boxes) that all have the same reconstruction score rj. Blue edges represent true positive interactions, and red edges represent false positives. The goal of breaking ties is to re-rank the tied paths so paths with more positives are ranked higher (black box). b Simplified model diagram for the signaling flow structure. Blue edges represent valid interactions. The blue solid edges are between pairs of proteins sharing one cellular compartment, and the blue dotted edges are proteins that traverse between two compartments. Paths that violate our signaling model assumptions are shown in red, where path (b) has a single interaction between a pair of proteins without a common cellular compartment, and signaling in path (c) does not reside in the nucleus once it reached the nuclear compartment

