Fig 6.

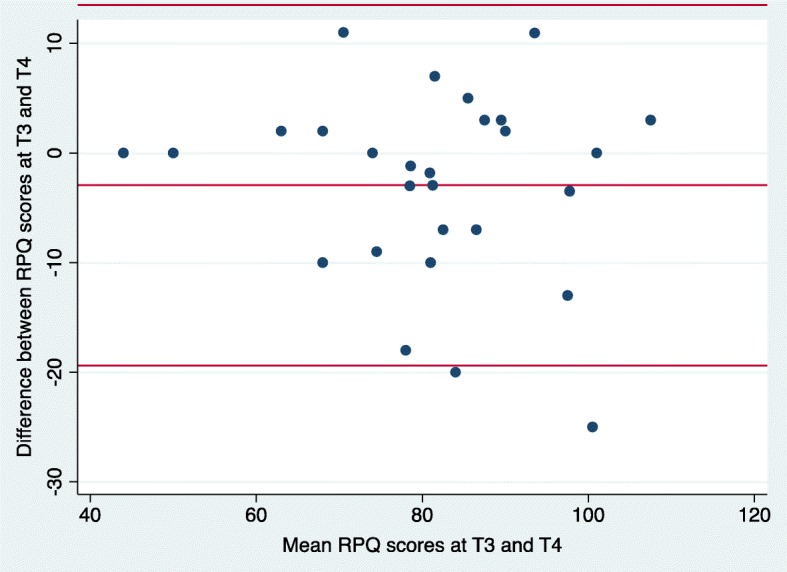
Bland-Altman plots for RPQ scores at time 3 and time 4. The middle line represents the mean difference between RPQ scores at time 3 and time 4. The lower and upper lines represent the upper and lower 95% confidence limits respectively

Bland-Altman plots for RPQ scores at time 3 and time 4. The middle line represents the mean difference between RPQ scores at time 3 and time 4. The lower and upper lines represent the upper and lower 95% confidence limits respectively