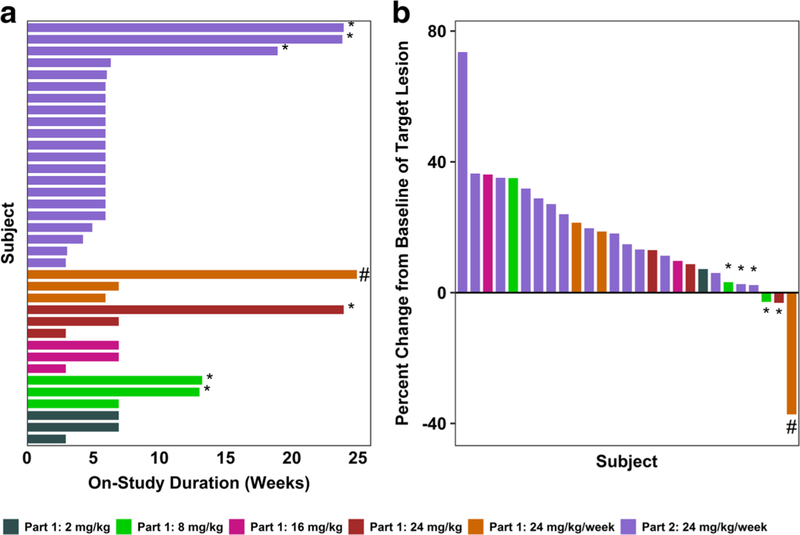
Fig. 2. Duration of treatment and percent change in tumor burden following treatment with U3–1565.
a Duration of time in weeks that individual subjects at each dose level were treated during the study main phase. b Best percent change from baseline in the sum of longest diameters of target lesions by treatment group. Subjects achieving SD (*) or PR (#) are indicated. Nine subjects are not included in the waterfall plot for the following reasons: Discontinuation from the study before tumor size assessment occurred (7 subjects, 5 due to clinical disease progression, 1 due to an SAE, and 1 due to loss to follow up), and unavailability of tumor size data (2 subjects)

