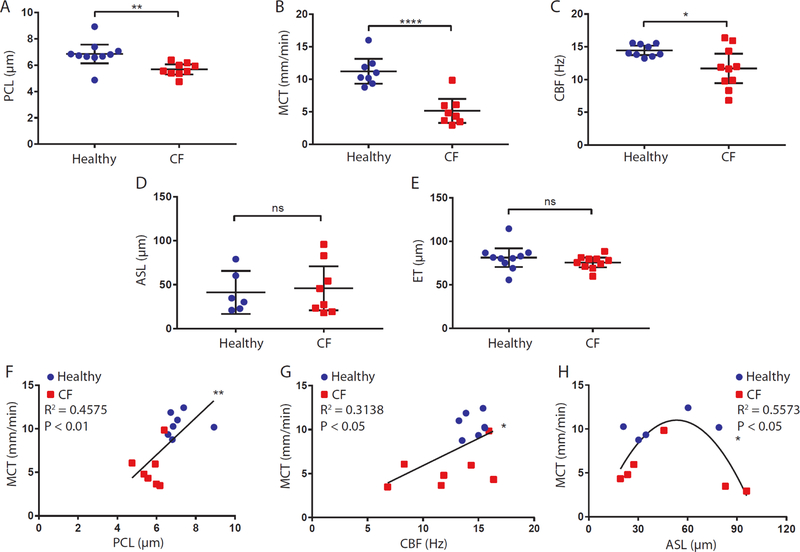
Fig. 2. Functional microanatomy measurements from μOCT images.
(A to E) Scatter plots of PCL, MCT, CBF, ASL, and ET measurements of healthy and CF cohorts. (F and G) Scatter plots with linear fits of PCL (F) and CBF (G) versus MCT. Only subjects with PCL, MCT, and CBF that were all successfully measured (n = 14) were included in the analysis. (H) Scatter plots with nonlinear fit of ASL versus MCT (n = 11) showing a quadratic relation. Each data point represents the mean measurement for each individual. Bars are means and 95% CI. Comparison of data in (A) by Mann-Whitney test, and (B to E) by t test with Welch’s correction. All linear and nonlinear fits in (F) to (H) were performed with the combined data from both CF (red) and non-CF (blue) cohorts. *P<0.05; **P<0.01; ****P<0.0001. PCL: Periciliary liquid layer depth; MCT: Mucociliary transport rate; CBF: Ciliary beat frequency; ASL: Airway surface liquid layer depth; ET: Epithelium thickness.

