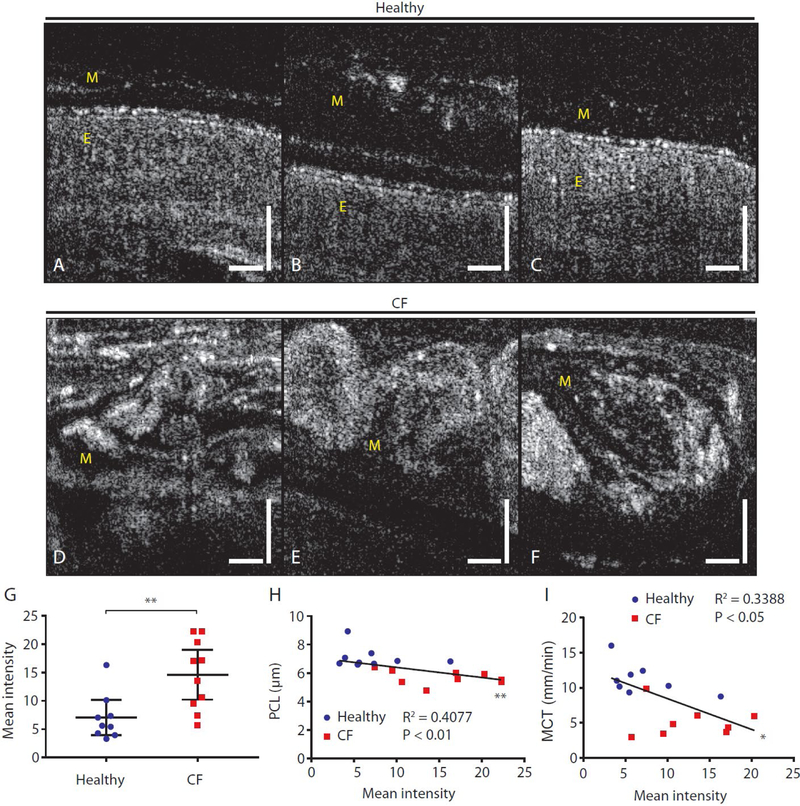
Fig. 5. Prominent and heterogeneous mucus reflectance intensity in CF subjects as compared to healthy non-CF controls.

(A to C) Typical μOCT images from healthy subjects showing continuous PCL, smooth epithelial surfaces, and a weakly scattering mucus layer above the ciliary layer. (D to F) Images from CF subjects showing highly reflective and heterogeneous mucus with distinctive structure accumulated to large thicknesses. View of the underlying epithelial tissue is obscured by mucus. (G) Scatter plot showing mean mucus reflectance intensity in CF compared to healthy non-CF controls. (H and I) Correlations between mean mucus reflectance intensity in vivo and airway hydration reflected by PCL depth (H) and MCT rate (I). Vertical and horizontal bars = 50 μm. *P<0.05; **P<0.01 by Mann-Whitney test. PCL: Periciliary liquid layer depth; MCT: Mucociliary transport rate. Mucus and epithelium are indicated with M and E, respectively.
