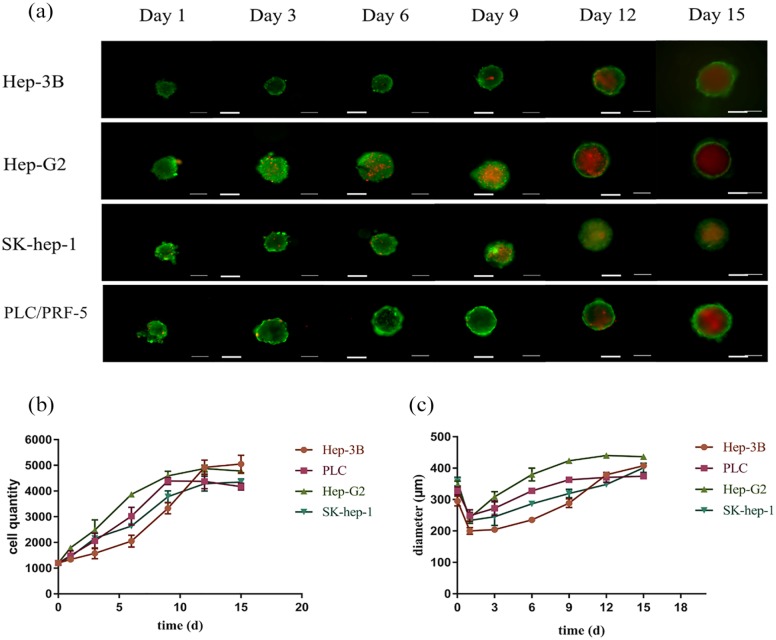
Figure 3.
Proliferation of HCC cell lines in agarose microwell 96-well plates. (a) Calcein-AM/PI staining of HCC cell spheroids at different time points. (b) Cell counts of HCC cell spheroids at different time points. (c) Diameter of HCC cell spheroids at different time points. Data are shown as the mean ± SD of triplicate experiments. Scale bar = 200 μm.

