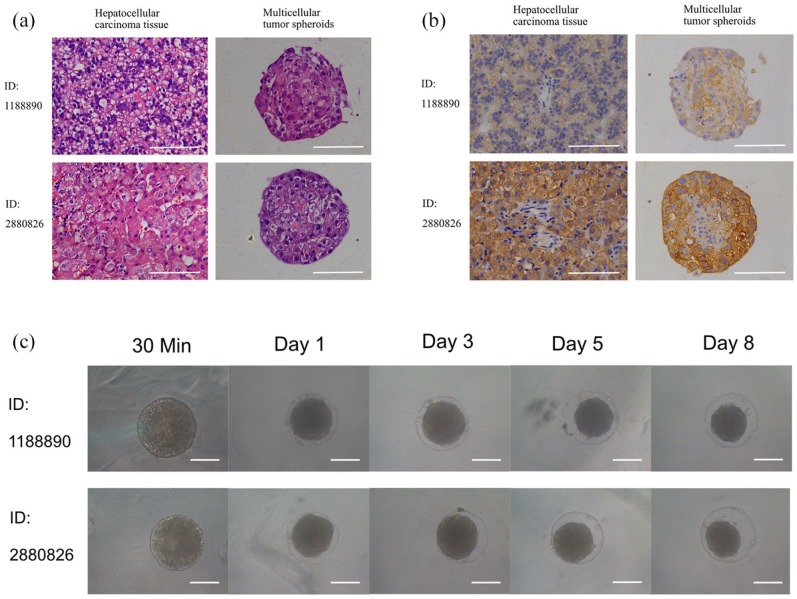
Figure 6.
Images of spheroid culture of primary cells. (a) HE staining of tumor tissue and corresponding multicellular tumor spheroids. (b) immunohistological staining of tumor tissue and corresponding tumor spheroids with ARG-1. (c) Primary cells cultured in agarose microwells 96-well plates at different time points. Scale bar = 200 μm.

