Figure 1.

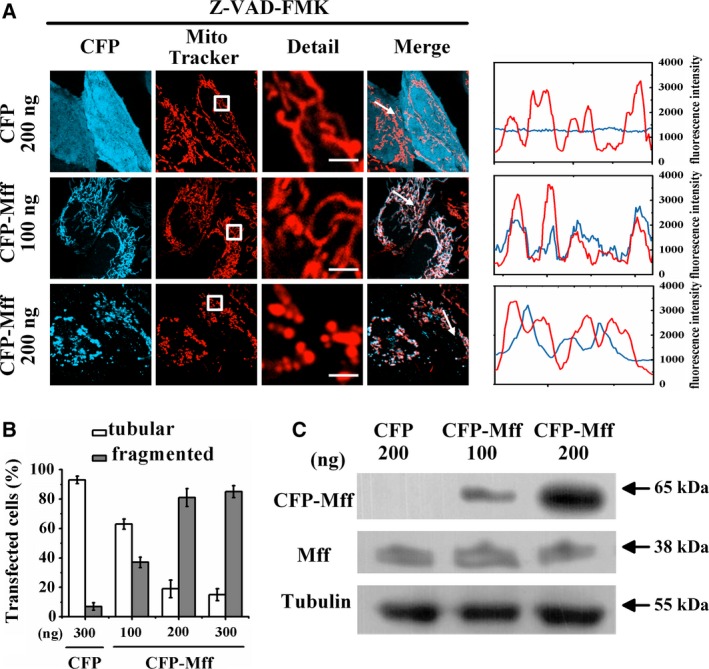
Mff facilitates mitochondrial fragmentation. (A) Fluorescence microscopic images of living cells transfected with the indicated amounts of CFP (empty vector) or CFP‐Mff and also stained with MitoTracker. All treatments were carried out in the presence of 50 μm Z‐VAD‐FMK for inhibiting apoptosis. Scale bars: 2 μm. Line scans show the fluorescence intensities of CFP signals (cyan) and mitochondria stained by MitoTracker (red) along the selected white arrows in the merge panels. (B) Percentages of cells with indicated mitochondrial morphologies in CFP‐positive cells (n = 150) transfected with the indicated amounts of plasmids. Data were collected from three independent experiments. The error bars represent SD. (C) Expression level of Mff in HeLa cells transfected with the indicated amounts of CFP (empty vector) or CFP‐Mff assessed by western blotting.
