Figure 5.

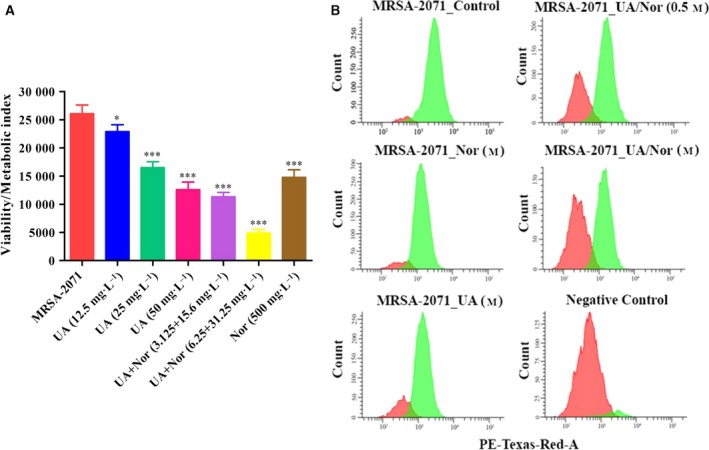
(A) Metabolic activity assay using resazurin. A gradual decline in metabolic activity of MRSA‐2071 cells was recorded with various concentrations of UA alone and the decrease was most prominent in the cells exposed to MIC concentrations of UA–norfloxacin combinations. The results are mean ± SEM derived from three independent experiments (*P ≤ 0.05, ***P ≤ 0.001 Dunnett's test). (B) Flow cytometric analysis for respiratory activity. Graphical representation of cell count vs CTC mean intensity (phycoerythrin‐Texas‐Red‐A) obtained in fluorescence‐activated cell sorting analysis of MRSA‐2071 control and treated samples. A dose‐dependent significant reduction in mean CTC intensity was observed compared to untreated control (n = 3). Negative control was prepared by fixing the cells with formaldehyde and glutaraldehyde prior to CTC staining.
