
Figure 3.
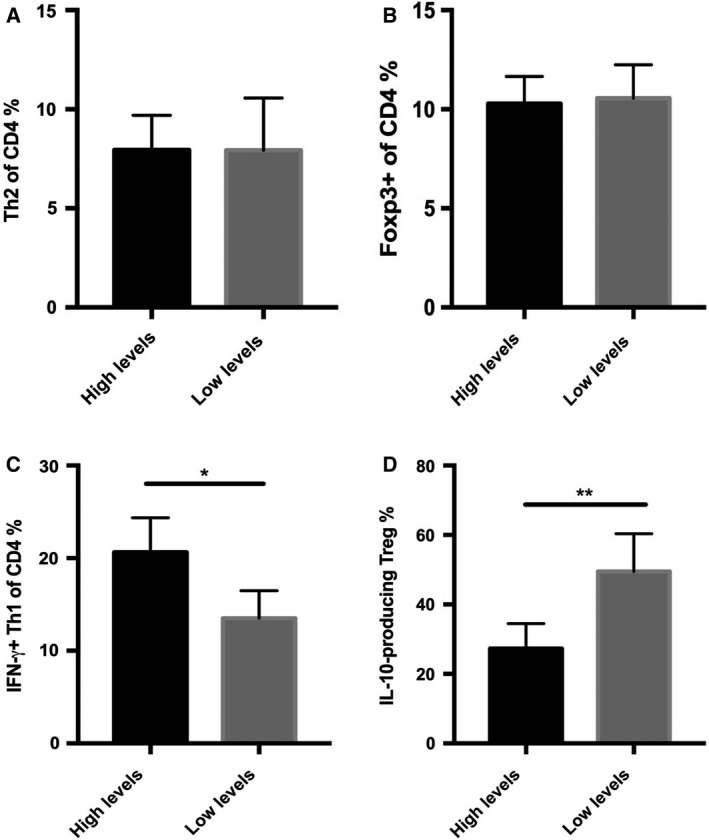
The frequency of Th1, Th2 and IL‐10+ Treg cells in the CD4+ T cells from patients. (A) The frequency of IL‐4+ Th2 measured by intracellular flow cytometry assay from PBMCs of patients with a higher or lower level of TSLP. (B) The frequency of CD4+CD25+ Foxp3+ Treg cells measured by flow cytometry from PBMCs of patients with higher or lower levels of TSLP. (C) The frequency of proinflammatory IFN‐γ+ Th1 cells measured by flow cytometry from PBMCs of patients with higher or lower levels of TSLP. (D) The frequency of proinflammatory IFN‐γ+ Th1 measured by flow cytometry from PBMCs of patients with higher or lower levels of TSLP. Data are presented by mean ± SD (error bar). The unpaired Student’s t‐test was used for statistical analysis. The two‐sided test was applied. P < 0.05 indicated statistical significance: *P < 0.05, **P < 0.01. n = 10.