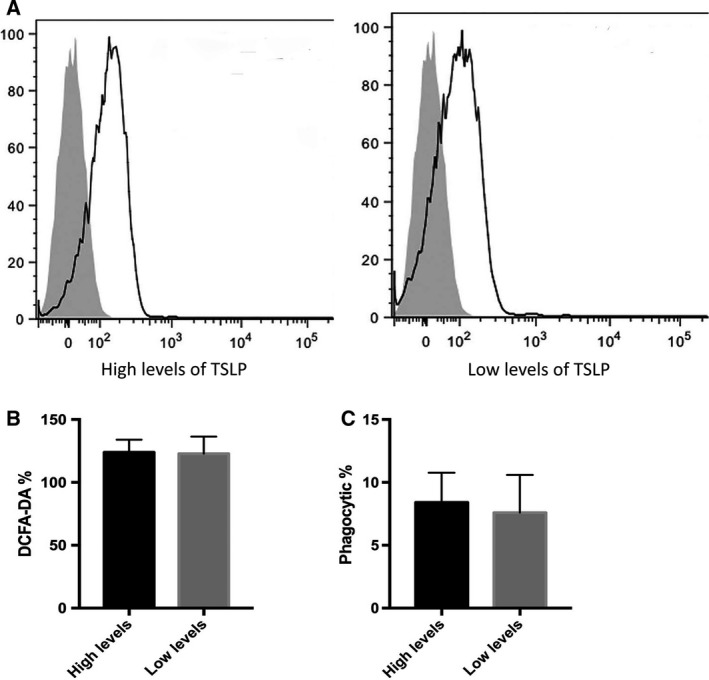
Figure 4.

The evaluation of phagocytosis and production of reactive oxygen species in the neutrophils isolated from patients. (A) The representative figures of mean fluorescent intensity (MFI) evaluated by flow cytometry in the neutrophils stimulated by HKSA. (B) The quantitative analysis of 2’,7’‐dichlorodihydrofluorescin diacetate intracellular staining in the HKSA/PMA‐stimulating neutrophils isolated from patients with a higher or lower level of TSLP. (C) The frequency of FITC‐labeled phagocytic neutrophils observed by fluorescent microscope in the neutrophils from patients. Data are presented as mean ± SD (error bar). Two‐sided Student’s t‐test was applied. P < 0.05 indicated statistical significance. n = 10.
