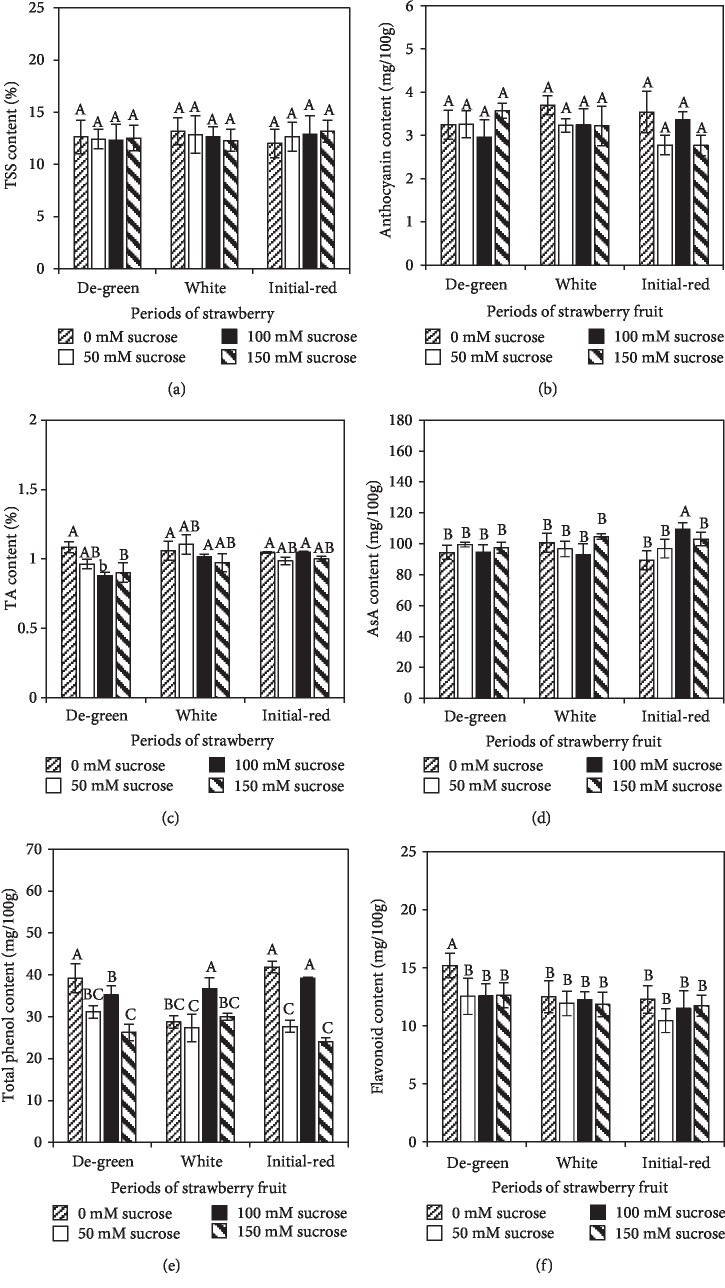
Figure 2.
Strawberry fruit nutritional quality and bioactive compound content after 50 mM, 100 mM, or 150 mM sucrose application at DG, W, and IR stages. 0 mM sucrose indicated control fruits treated with water. Bars represented the mean values ± stand error. (a) Total soluble solids, (b) anthocyanin content, (c) titratable acidity content, (d) AsA content, (e) total phenol content, and (f) flavonoid content in full-red strawberry fruit under different treatments. Different letters on the bars represent the significance at the P ≤ 0.05 level.

