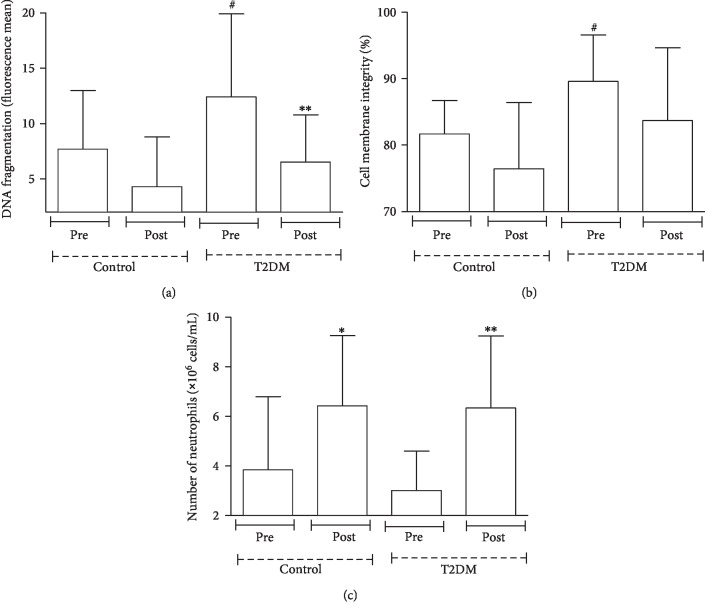
Figure 3.
Number of neutrophils, the extent of DNA fragmentation, and membrane cell integrity in participants with T2DM and healthy participants before and four months after dance training. Data are represented as the mean ± SE of at least 7 participants per group. ∗p < 0.05 precontrol group vs. postcontrol group; ∗∗p < 0.05 pre-T2DM group vs. post-T2DM group; #p < 0.05 precontrol group vs. pre-T2DM group.

