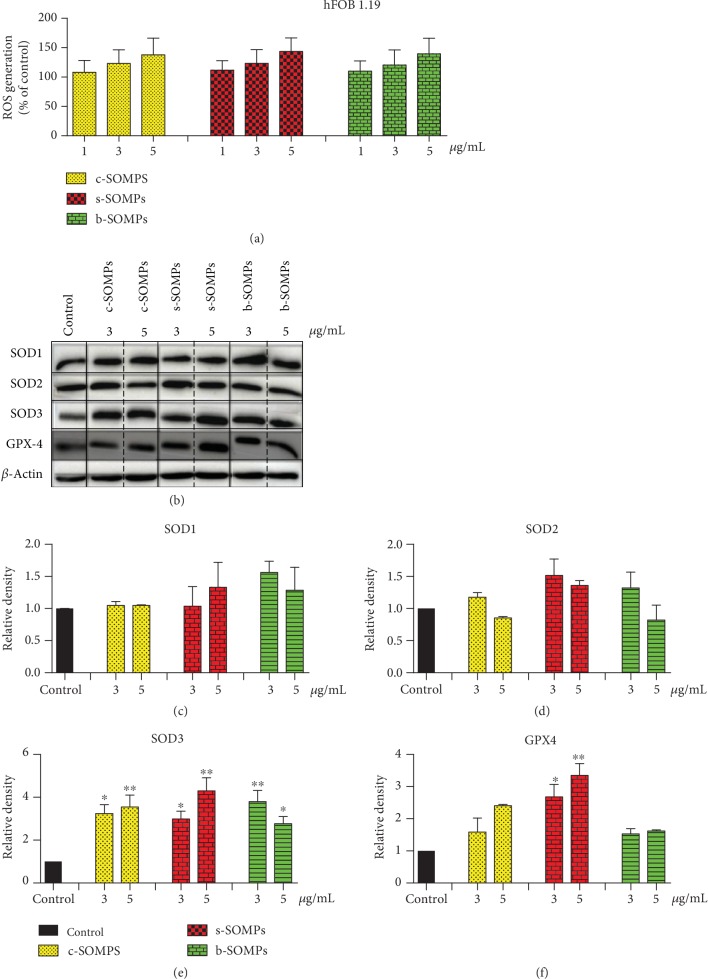
Figure 6.
Impact of SOMPs on oxidative stress in hFOB1.19 cells. (a) ROS levels, (b) representative Western blots, (c) quantification of SOD1 levels, (d) quantification of SOD2 levels, (e) quantification of SOD3 levels, and (f) quantification of GPX4 levels in hFOB1.19 cells after incubation with c-SOMPs, s-SOMPs, or b-SOPMs for 24 h. Data are presented as mean ± SD. ∗p < 0.05, ∗∗p < 0.01, ∗∗∗p < 0.001.

