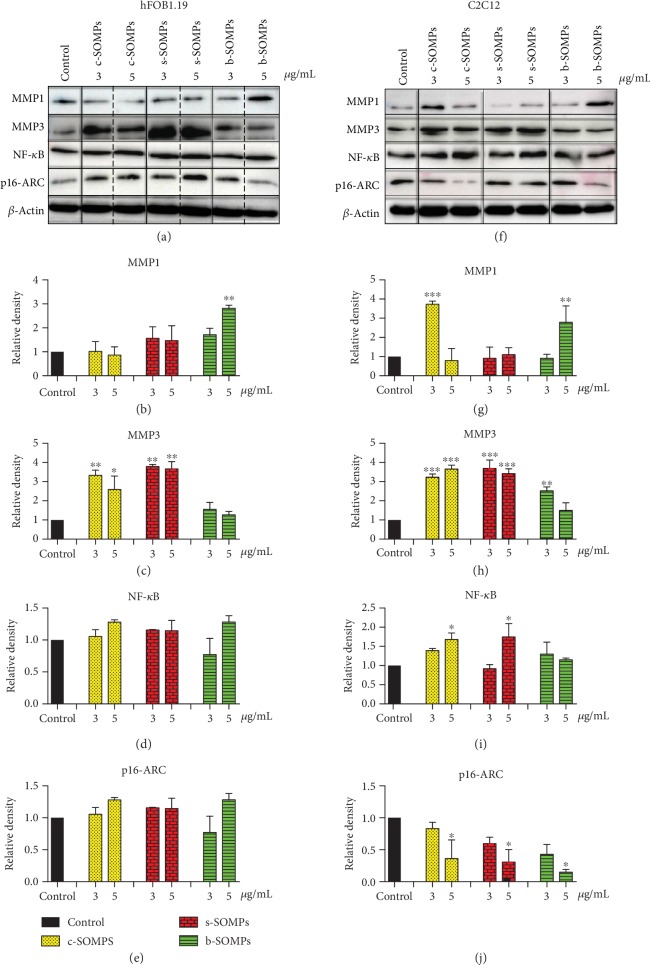
Figure 7.
Impact of SOMPs on selected proteins levels. Representative Western blot analysis of (a) hFOB1.19 and (b) C2C12 cells after 24 h incubation with c-SOMPs, s-SOMPs, or b-SOPMs. Quantitative analysis of (b), (g) MMP1; (c), (h) MMP3; (d), (i) NF-κB, and (e); and (j) p16-ARC levels on hFOB1.19 and C2C12 cell lines, respectively. Data are presented as mean ± SD. ∗p < 0.05, ∗∗p < 0.01, ∗∗∗p < 0.001.

