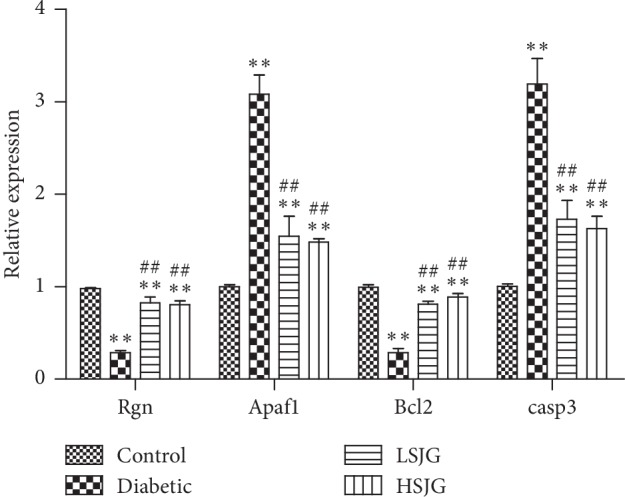
Figure 7.

Confirmation of four representative differentially expressed genes by qPCR. Values are mean ± S.D. (n = 6), ∗∗P < 0.01 compared with the normal group, and ##P < 0.01 compared with the DN group. Rgn: regucalcin; Apaf1: apoptotic peptidase activating factor 1; and Casp3: caspase 3.
