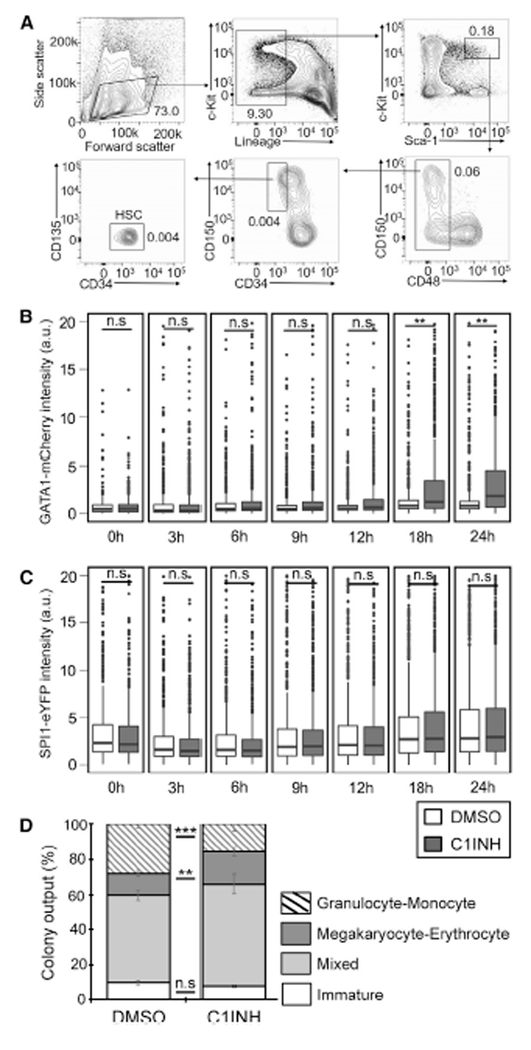
Figure 5. Inflammasome Inhibition Increases GATA1 Protein Amounts and Megakaryocyte-Erythrocyte Colony Output in Mouse HSCs.
(A) Flow cytometry gating scheme used for isolation of mouse HSCs. HSCs are sorted as Lin−cKit+Sca1+CD48−CD34−CD135−CD150+. Numbers in the plots indicate % of lineage-depleted BM cells.
(B and C) Caspase1-inhibitor (C1INH) treatment increases GATA1 protein amounts (B) without affecting SPI1 protein amounts (C) in mouse HSCs. Data were acquired by time-lapse imaging of freshly-sorted HSCs (DMSO = 605, C1INH = 749 HSCs) from 12-week old SPI1-eYFP and GATA1-mCherry fluorescent protein fusion reporter mice in IMDM + BIT + SCF + Epo + Tpo + IL3 + IL6 supplemented with or without 100 mM of the irreversible caspase-1 inhibitor Ac-YVAD-CMK (2 biological replicates).
(D) Caspase1-inhibitor treatment increased MegE colony output at the expense of GM colonies. HSCs from SPI1-eYFP and GATA1-mCherry reporter mice were single-cell sorted into 384 well plates in IMDM +BIT+SCF +Epo + Tpo + IL-3 + IL-6 supplemented with or without 100 μM Ac-YVAD-CMK. At day 8, color conjugated CD41-APC and CD16/32-BV421 antibodies were added to the colonies and colonies were imaged and manually scored using morphology, SPI1-eYFP and CD16/32 signal to indicate GM colonies and GATA1-mCherry and CD41 signal to indicate MegE colonies. Data represent mean percentage of types of colonies formed from HSCs from 4 independent experiments (244 total colonies scored, error bars = SEM). ns, not significant; *p < 0.05; **p < 0.01; ***p < 0.001 according to two tailed Student’s t test (A, B) and Chi-square test (C).

