Figure 4.
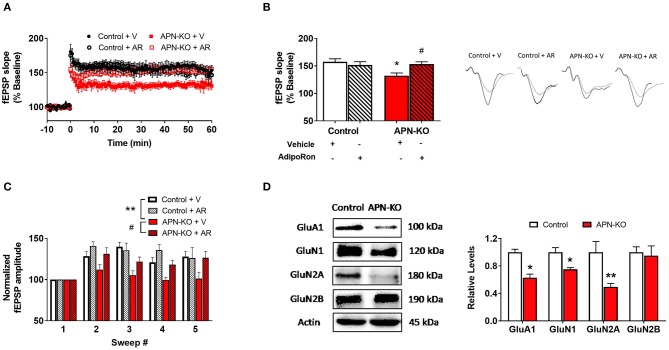
Deficits in LTP in APN-KO mice are associated with reduced levels of glutamatergic receptor subunits. For (A–C), hippocampal slices were prepared from Control and APN-KO mice and incubated for 2-h in either ACSF containing 0.03% DMSO [Vehicle (V)] or ACSF containing 15 μM of AdipoRon and 0.03% DMSO [AdipoRon (AR)] prior to recording. (A) LTP graph represents fEPSP slope before and after induction by TBS. (B) LTP bar graph shows fEPSPs recorded during the time period 50–60 min following TBS induction normalized to baseline levels, and traces before and after LTP induction are shown. (C) Sweep analysis computed by normalizing the amplitude of the first fEPSP of sweeps 2–5 with the amplitude of the first fEPSP of sweep 1 during LTP induction. (D) Representative immunoblot showing GluA1, GluN1, GluN2A, and GluN2B relative levels normalized to beta-actin in total hippocampal lysate. Forty micrograms of protein were loaded per lane. Bars represent mean ± SEM; *indicates significant difference between APN-KO and Control, #indicates significant difference between APN-KO and APN-KO + AR; */#p < 0.05, **p < 0.01; for (A–C), n = 5–6 slices from 4 mice per group; for (D), n = 3–4 mice per group; Tukey's post hoc test was used for multiple comparisons.

