
Figure 1.
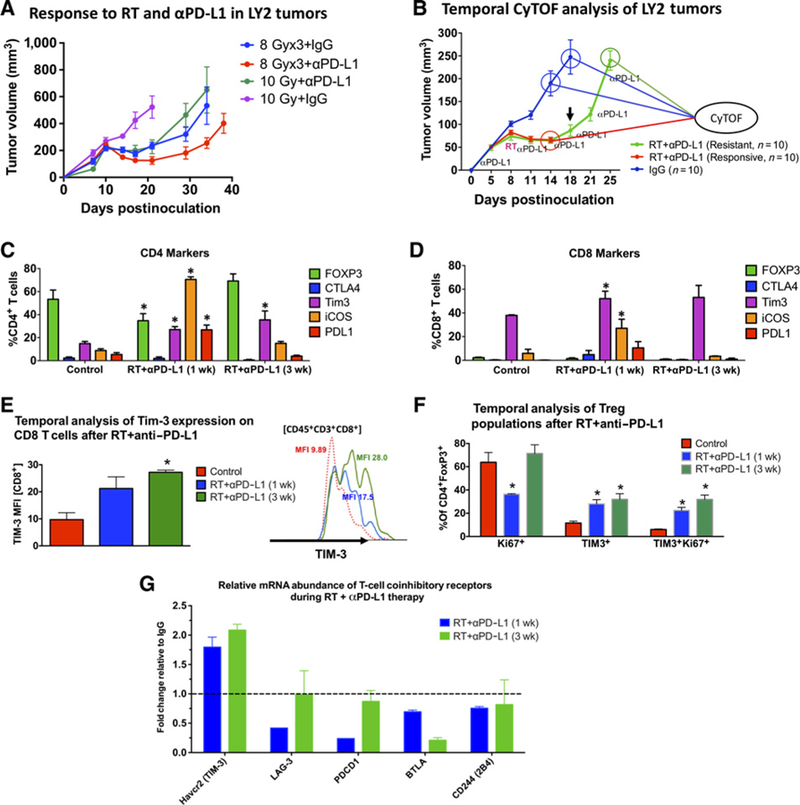
Temporal analysis of the T-cell immune landscape in HNSCC tumors in response to RT and anti–PD-L1 therapy. A, Tumor response to RT and anti–PD-L1 in LY2 tumors treated with single-dose 10 Gy or 3 doses of 8 Gy delivered 3 days apart. Anti–PD-L1 was started on day 7 and maintained for 2 weeks at 2 doses per week. RT commenced on day 10. Black arrow shows time point at which tumor regrowth was observed. Each group contained 7 mice. B, Tumor growth analysis showing timeline at which tumors were harvested for CyTOF analysis. Ten mice per group were included in the analysis. C and D, CyTOF analysis of markers expressed on CD4 and CD8 T cells. Gating was performed on live, CD45+ CD3+ cells. The Y axis shows the percentage of CD4 or CD8 T cells expressing the respective markers. E, Temporal analysis of the phenotype and proliferation status of Tregs (gated on live CD45+CD3+CD4+FoxP3+) in response to RT anti–PD-L1. F, Temporal analysis of TIM-3 expression based on MFI on CD8 T cells in response to RT+anti–PD-L1. Two-way ANOVA was performed to assess significance between each group relative to the control IgG group. Asterisks denote P < 0.05. G, Analysis of gene expression of T-cell coinhibitory receptors from orthotopic LY2 tumors obtained 1 week and 3 weeks after RT and anti–PD-L1 treatment. Data are presented as fold change relative to gene expression from untreated tumors.