
Figure 2.
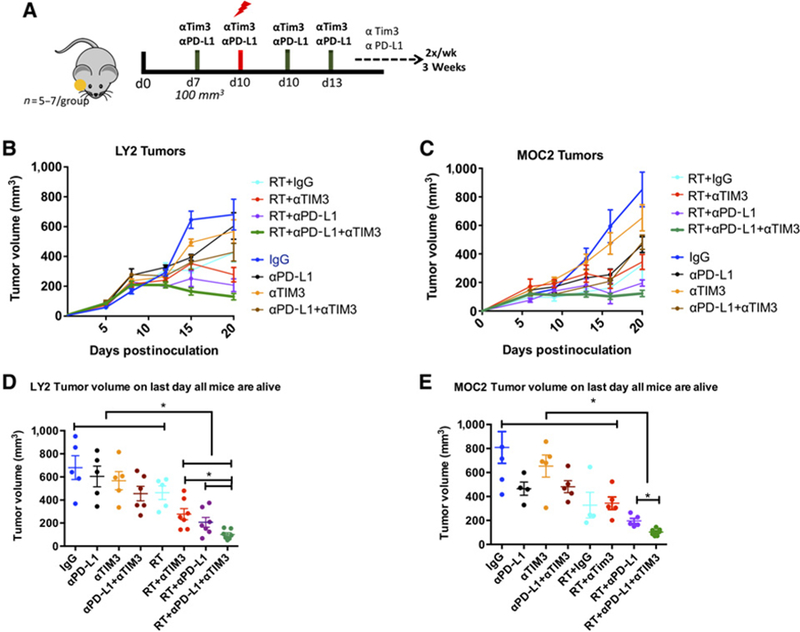
Response of LY2 and MOC2 tumors to treatment with RT, αPD-L1, and αTIM-3 alone and in combination. A, Schematic illustration of treatment schedule. B and C, Tumor growth analysis of LY2 (Balb/c) and MOC2 (C57Bl/6) tumor-bearing mice. Mice received mAb against PD-L1, TIM-3, or IgG on day 7 and 10 Gy RT on day 10. Antibodies were delivered 2×/week for 2 weeks. D and E, Statistical analysis was performed on day 19 when mice from all groups were alive using two-way ANOVA. Asterisk denotes significance (P < 0.05).