
Figure 6.
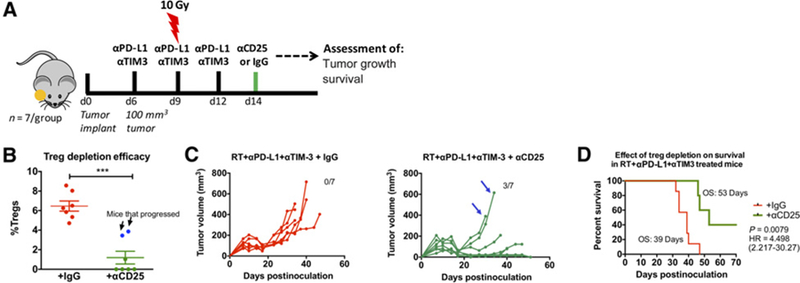
Effect of Treg depletion on tumor response to RT and dual immune checkpoint blockade. A, Schematic illustration of dosing timeline. Mice were treated with RT+αPD-L1+αTIM3 similar to previous experiments. Anti-CD25 was administered at the time point at which tumors were regressing (1 week after initiation of RT+αPD-L1+αTIM3) and maintained at 1 dose per week. B, Depletion of Tregs was confirmed with flow cytometric analysis of blood samples 4 days after the first dose of anti-CD25. Arrows show data points for mice that had high proportion of Tregs despite anti-CD25 administration. Unpaired t test was used to assess significance. C, Individual tumor growth analysis of mice treated with anti-CD25 (green) or IgG (red) and RT+αPD-L1+αTIM3. Arrows show tumor growth profile of the 2 mice which had high Treg proportion despite anti-CD25 administration. D, Survival analysis in mice that received anti-CD25 (green) or IgG (red) in addition to RT+αPD-L1+αTIM3. Log-rank test was used to assess significance between groups.