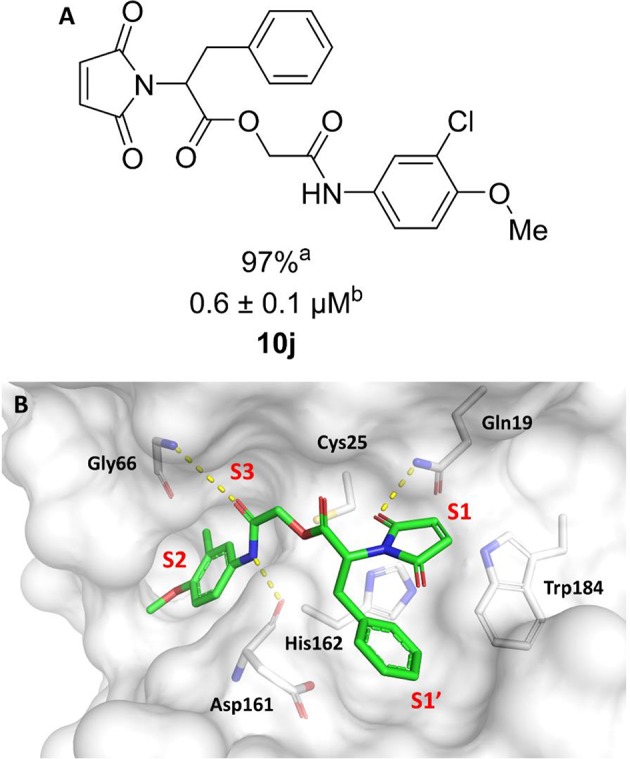
Figure 6.

(A) Modifications to the imide nucleus and hydrophobic fragment. aPercent inhibition against cruzain at 100 μM corresponding to the mean of three measurements. bIC50 values against cruzain, which were independently determined by obtaining rate measurements in triplicate for at least six inhibitor concentrations. The IC50 values correspond to the mean ± SD of three individual experiments. ND, IC50 not determined. (B) Molecular docking predicted binding mode of compound 10j. Cruzain (PDB 3KKU, 1.28 Å) is depicted in surface representation. Binding site residues (carbon in gray) and inhibitors (carbon in green) are shown as sticks. Hydrogen bonds are shown as dashed lines. Cruzain subsites are labeled as S1, S1', S2, and S3.
