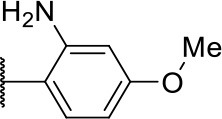
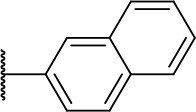
Table 2.
Cruzain inhibition and trypanocidal activity of compounds with modifications to the hydrophobic fragment and the amide function.
 | |||
|---|---|---|---|
| Compound | Structure | IC50 cruzain (μM)a | IC50 T. cruzi (μM)b |
| 10h |  |
1.4 ± 0.8 | >100 |
| 10j |  |
0.6 ± 0.1 | 1.0 ± 0.3 |
| 7 |  |
ND | 1.5 ± 0.4 |
IC50 values against cruzain were independently determined by obtaining rate measurements in triplicate for at least six inhibitor concentrations. The values represent the mean ± SD of three individual experiments.
IC50 values against T. cruzi represent the mean ± SD of two individual experiments. ND, not determined.
