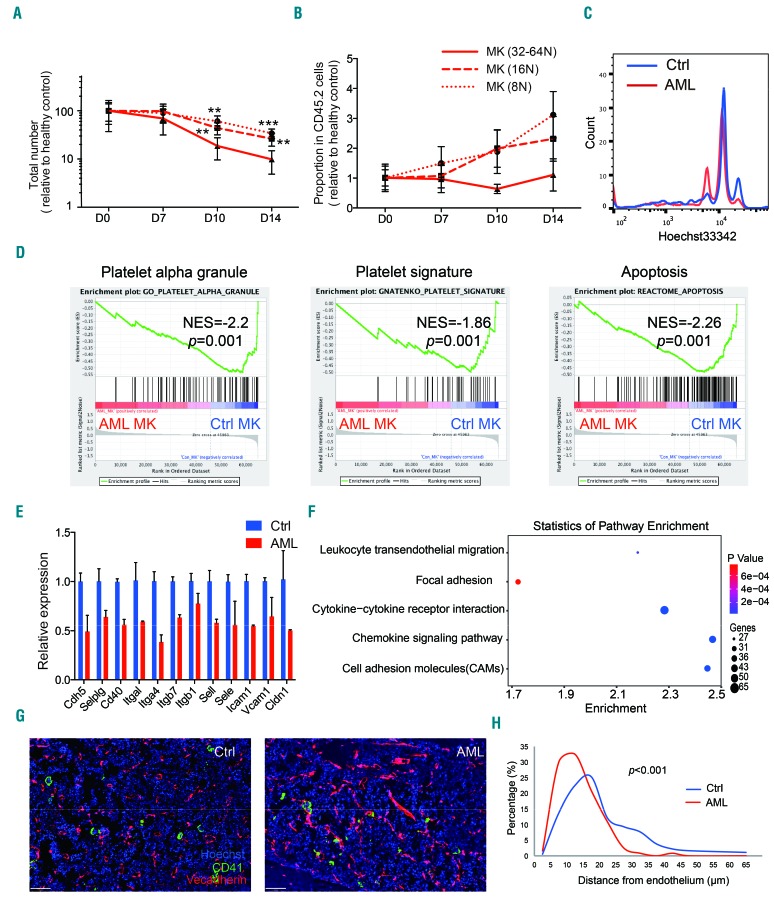
Figure 3.
Insufficient maturation of megakaryocytes in acute myeloid leukemia bone marrow. (A) Total numbers of megakaryocytes (MK) with different ploidy in mice bone marrow at indicated time points of the development of acute myeloid leukemia (AML). Data were normalized to the values of healthy controls (Ctrl) and are presented as the percentages of control. Four or five mice for each time point, three independent experiments. (B) Proportions of MK with different ploidy in normal hematopoietic cells in mice bone marrow at the indicated time points of AML. Data were normalized to the values of healthy control and are presented as the folds of control. Four or five for each time point, three independent experiments. (C) Representative flow cytometric plot of MK ploidy distribution in healthy control and AML mice bone marrow (day 14). (D) Negative enrichment of platelet α-granule genes, platelet signature genes and apoptosis pathway in AML bone marrowderived MK. NES: normalized enrichment score; P, family-wise error rate (FWER) P-value. (E) Significantly downregulated (P<0.05) genes encoding adhesion molecules in MK from AML bone marrow. Data are presented as fold-change of gene expression relative to the expression in healthy controls. (F) Significant enrichment of downregulated genes in cell-cell or cell-matrix interaction associated KEGG pathways in MK from AML bone marrow. (G) Representative confocal images of CD41+ MK (green) and VE-cadherin+ vasculature (red) in control and AML (day 14) mice femora. The scale bar represents 70 μm. (H) Quantification of the distance between MK (n=182 for controls, n=120 for AML) and endothelium. P values were calculated using a two-sample Kolmogorov–Smirnov test. *P<0.05, **P<0.01, ***P<0.001. Error bars represent the standard error of mean.

