Figure 5.
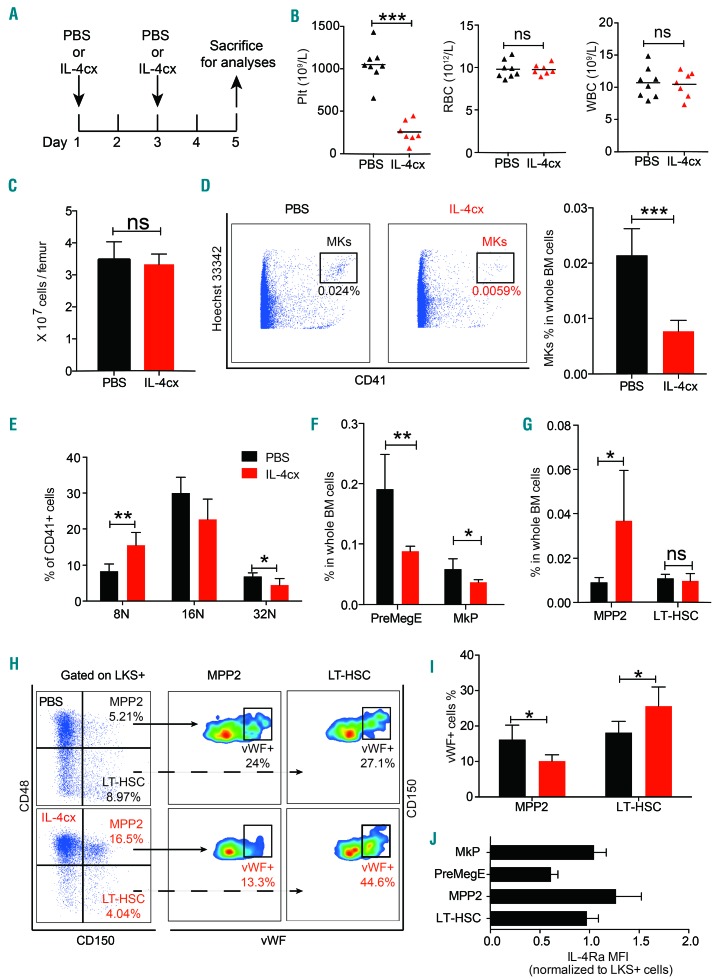
Inhibitory effects of interleukin-4 on megakaryopoiesis and thrombopoiesis in vivo. (A) Diagram of the experimental design: each mouse received intraperitoneal injections of 2 μg murine interleukin-4 (IL-4) complexed (cx) with 10 μg anti-mIL-4 (clone 11B11) or equivalent phosphate-buffered saline (PBS) on day 1 and day 3. Mice were sacrificed on day 5 for subsequent analyses. (B) Counts of platelets (Plt), erythrocytes (RBC) and leukocytes (WBC) in peripheral blood of mice injected with PBS or IL-4 complex (IL-4cx). Seven to eight mice per group; three independent experiments. (C) Total number of whole bone marrow cells per femur in mice injected with PBS or IL-4cx. Five mice per group; three independent experiments. (D) Representative flow cytometric plots (left) and percentage (right) of megakaryocytes (MK) in PBS or IL-4-treated mice bone marrow. Five mice per group, three independent experiments. (E) Percentages of MK with different ploidy among CD41+ cells in the bone marrow of mice treated with PBS or IL-4. Five mice per group, three independent experiments. (F, G) Percentages of pre-megakaryocytic-erythroid (PreMegE) (F), megakaryocyte progenitors (MkP) (F), long-term hematopoietic stem cells (LT-HSC) (G) and multipotent progenitors (MPP2) (G) in the bone marrow of mice treated wih PBS or IL-4. Five mice per group, three independent experiments. (H, I) Representative flow cytometric plots (H) and percentages (I) of von Willebrand factor (vWF)+ cells in LT-HSC and MPP2 in the bone marrow from mice treated with PBS or IL-4. Five mice per group, three independent experiments. (J) Mean fluorescence intensity (MFI) of IL4Rα on HSPC subsets, normalized to values in Lin−/c-Kit+/Sca-1+ (LKS+) cells. Four mice per group, two independent experiments. *P<0.05, **P<0.01, ***P<0.001. ns, no significant difference. Error bars represent the standard error of mean.

