Figure 1.
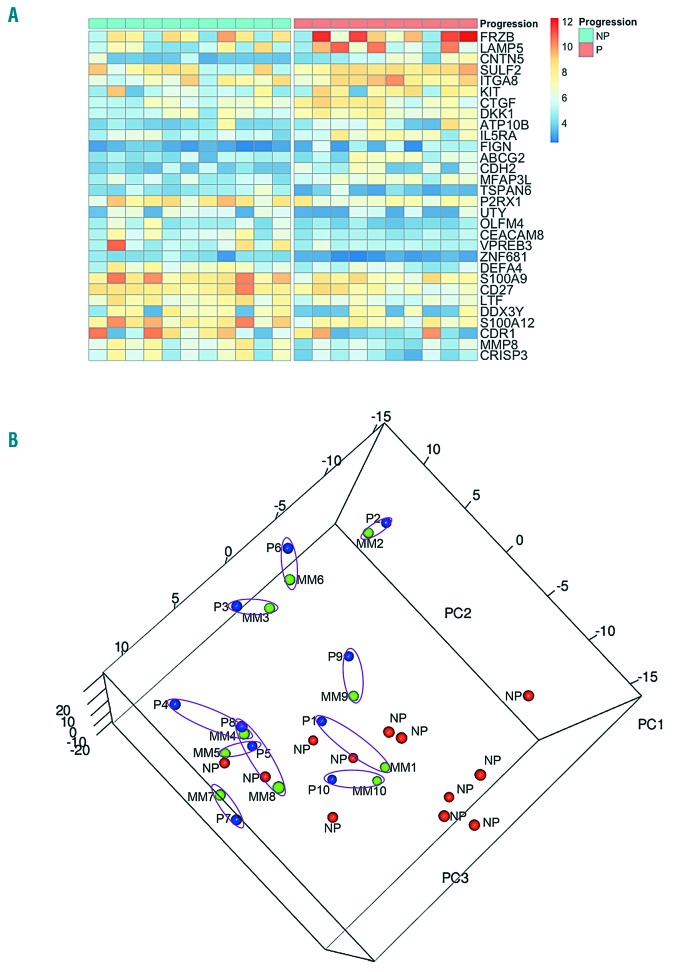
Differential transcriptomic profile between non-progressed and progressed smoldering multiple myeloma and paired smoldering and active myeloma samples. (A) Heatmap of the 30 most variable coding genes (highlighted in light blue in Online Supplementary Table S1) with at least a 2-fold change in expression levels in samples from ten patients whose smoldering multiple myeloma progressed (P-SMM) versus samples from 11 whose smoldering disease had not progressed (NP-SMM). (B) Three-dimensional visualization of the results of principal component analysis on the most variable transcripts across the whole dataset. NP-SMM samples (red dots) agglomerated in a distinguishable cloud from P-SMM samples (blue dots), which tended to aggregate with their active multiple myeloma (MM) (green dots) paired samples. The P-SMM and MM samples from the same patient share the same number and are highlighted by a purple circle. NP: non-progressed smoldering multiple myeloma, P: progressed smoldering multiple myeloma; MM: active myeloma.

