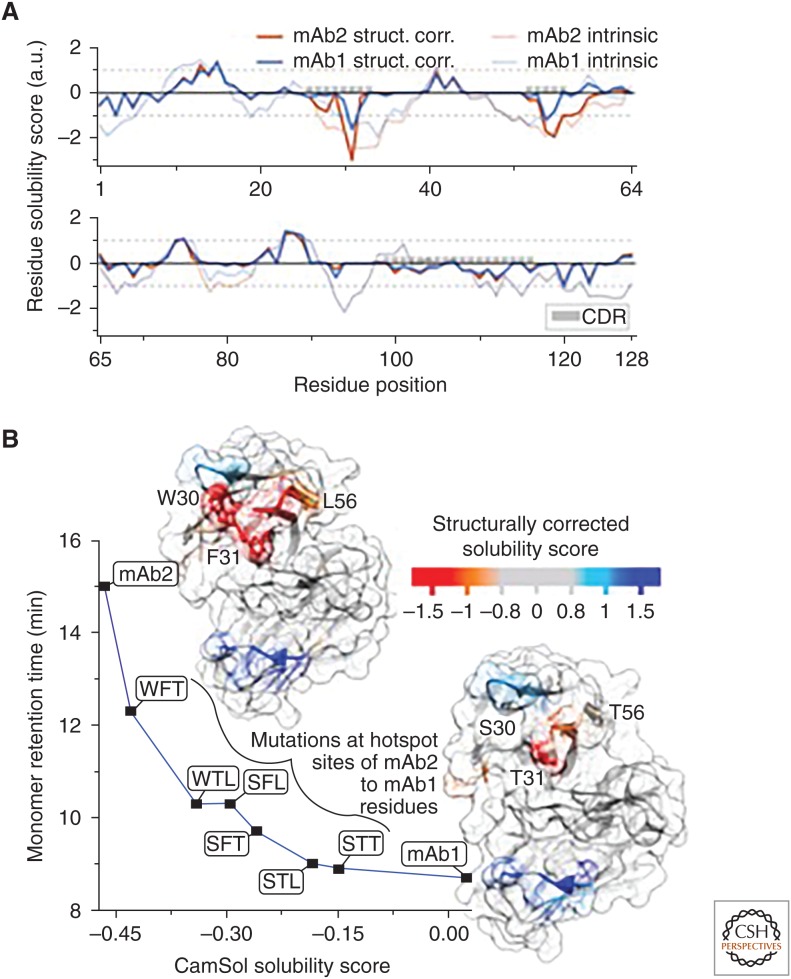
Figure 2.
(A) Structurally corrected (solid lines) and intrinsic (broken lines) CamSol solubility profiles for the VH domain of mAb1 (blue) and mAb2 (red), which are two of the monoclonal antibodies analyzed in Sormanni et al. (2017). The positions of the complemetarity-determining regions (CDRs) are highlighted with gray boxes. (B) The structurally corrected solubility profile is color coded on the surface of homology models of the VH/VL domains of mAb2 (top left) and mAb1 (lower right). The labeled residue positions on mAb2 (W30, F31, L57) are those that have been experimentally identified as aggregation hotspots (Dobson et al. 2016). Aggregation-promoting regions are in orange/red, whereas aggregation-protecting regions are in light blue/blue. The plot shows the measured high-performance size exclusion chromatography monomer retention time (Dobson et al. 2016) for various mAb variants as a function of their combined-chain solubility score calculated from the sequence alone. mAb2 has the residue types W, F, and L at the hotspot positions 30, 31, and 57, respectively, while mAb1 has S, T, and T. The six variants between mAb2 and mAb1 are named according to which mAb2 positions have been mutated to the corresponding mAb1 amino acid (e.g., WFT is mAb2 L57T). The line serves as a visual guide (adapted from Sormanni et al. 2017).

