Figure 4.
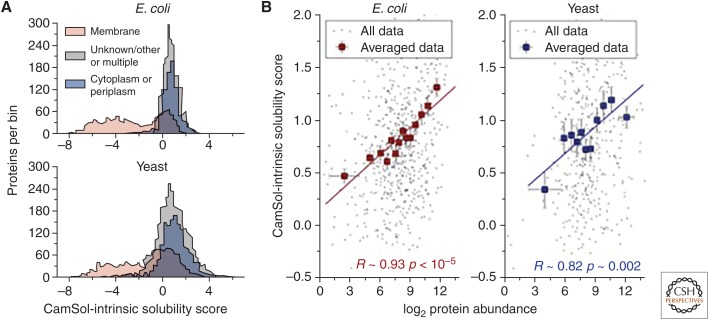
(A) Distribution of CamSol solubility scores for the whole proteome of Escherichia coli (top) and yeast (lower). Proteins are separated according to their subcellular location (see legend) as annotated in the UniProt database (UniProt Consortium 2018). (B) Scatterplots between protein abundance as determined with mass-spectrometry measurements (x-axis) and CamSol solubility scores (y-axis). Only nonmembrane proteins for which abundance data were available (Leuenberger et al. 2017) are included in these plots. Individual data points are in black, whereas corresponding averaged points are in red for E. coli (left) and blue for yeast (right). Averaged points report the mean CamSol score and abundance level of groups of ∼50 proteins binned according to their abundance. Error bars are standard errors on the mean, and the reported Pearson's correlation coefficients (R) and associated p values (p) are calculated for the averaged data.

