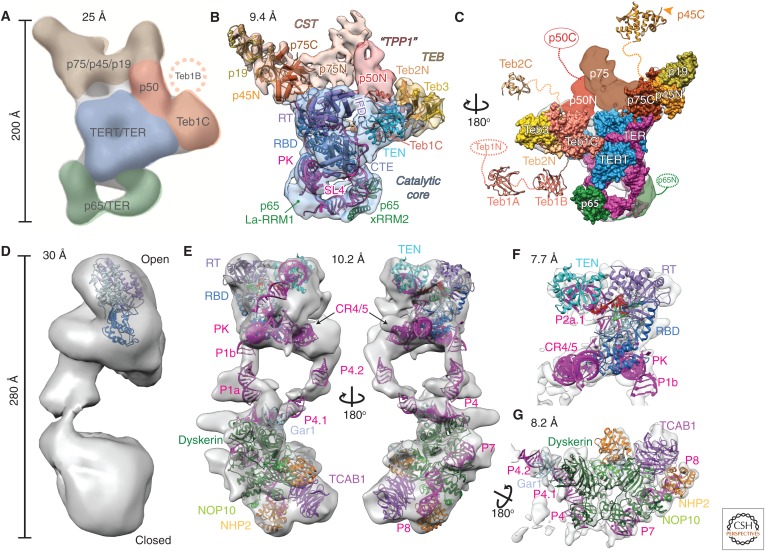
Figure 4.
Comparison of negative-stain and cryo-EM density maps and models of Tetrahymena and human telomerase. (A–C) EM density maps and models of Tetrahymena telomerase. (A) A 25 Å negative-stain EM map with locations and estimated boundaries of subunits colored, based on affinity tagging of subunits, comparison of particles lacking all or part of a subunit, and modeling of the catalytic core (Jiang et al. 2013) (EMDB: 5804). (B) A 9.4 Å resolution cryo-EM map (core RNP, blue; CST, tan; TEB, straw; and p50, red) and pseudoatomic models of the core RNP and TEB and CST trimerization domains of three OB folds (Jiang et al. 2015). (C) An 180° rotated view of B with modeled domains shown as space-fill on the cryo-EM map. Model of the catalytic core and TEB is based on the 8.9 Å resolution map. Additional domains of Teb1, Teb2, p45, p65, and p50 are not visible in the cryo-EM map because of positional dynamics and are shown as crystal structures (Teb1A [PDB: 3U4V], Teb1B [PDB: 3U4Z], p45C [PDB: 5DFN]), homology models (Teb2C based on PDB: 1DPU), or ovals. (D–G) EM density maps and models of human telomerase. (D) A 30 Å negative-stain EM map originally proposed to be a dimer (EMDB: 2310) (Sauerwald et al. 2013). Tribolium TERT was automatically fit into the map using UCSF Chimera (Pettersen et al. 2004). (E) Two views of the 10.2 Å resolution cryo-EM map of human telomerase holoenzyme (EMDB: 7521) with a modeled catalytic core (top) and H/ACA scaRNP (bottom) (Nguyen et al. 2018). (F) A 7.7 Å resolution cryo-EM map (EMDB: 7518) from focused refinement and model of the catalytic core. (G) A 8.2 Å resolution map (EMDB: 7519) from focused refinement and model of the H/ACA scaRNP. TER is magenta in all models and TERT is blue. Proteins and TER domains are labeled.

