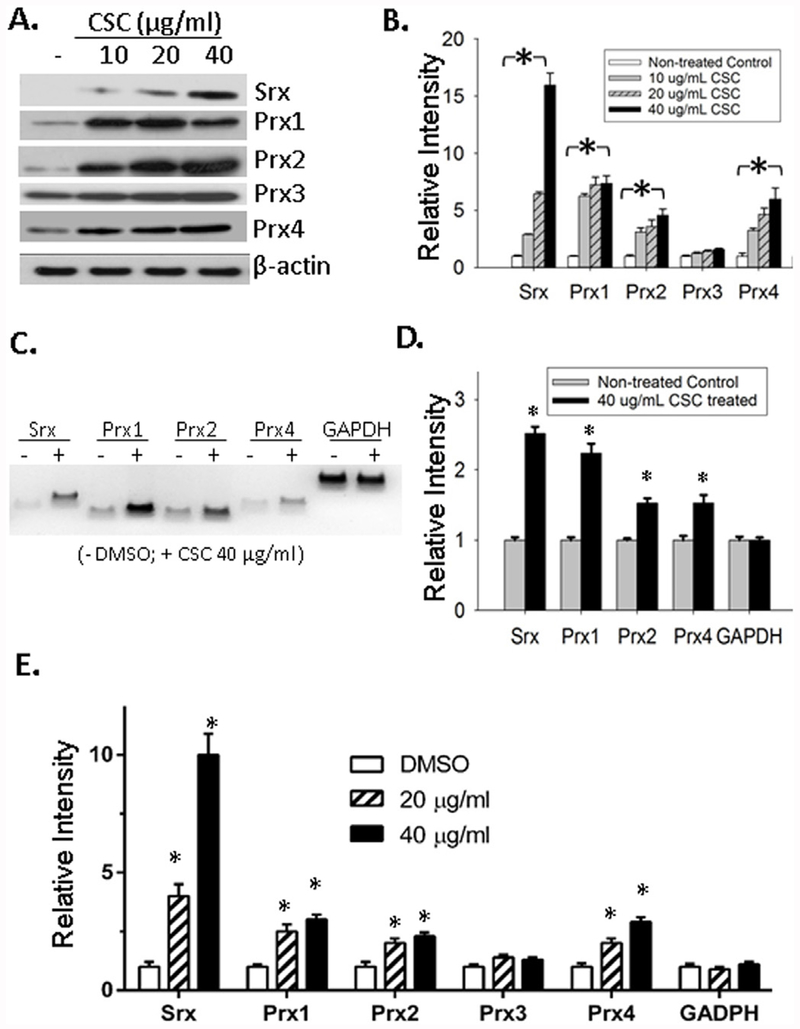
Fig. 1. CSC activated the expression of Srx and certain members of the Prxs in BEAS2B cells.
(A) Representative western blot results of Srx and Prxs in cells treated with CSC or vehicle DMSO at indicated concentration for 48 h. (B) Bands shown in (A) were quantitated and relative intensity was adjusted using the ratio to β-actin. Data from three independent experiments were analyzed. *p < 0.05 (n = 3, one way ANOVA). (C) Representative results of reverse transcription PCR to examine the mRNA levels of Srx and Prxs in control and CSC treated cells. (D) Bands shown in (C) were quantitated and relative intensity was adjusted using the ratio to GAPDH. Data from three independent experiments were analyzed. *p < 0.05 (n = 3, t-test). (E) The levels of specified mRNA were measured using quantitative real-time PCR and data from six repeats were analyzed. *Compared with DMSO control, p < 0.05 (n = 6, one way ANOVA).

