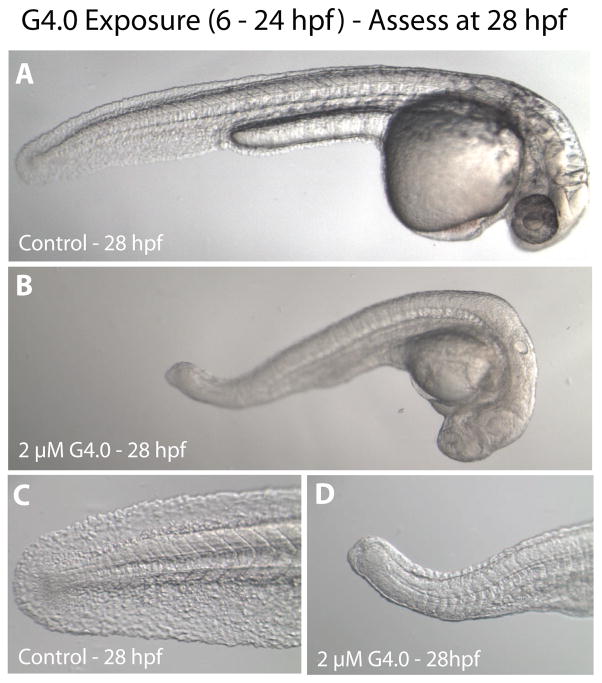
Figure 2.
Representative micrographs of overt toxicity seen in zebrafish embryos exposed to control or 2 μM G4 dendrimers beginning at 6 hpf. All micrographs were taken at 28 hpf. A. Control embryo manually removed from chorion (magnification 3.2×). B. G4 dendrimer-treated embryo manually removed from chorion (3.2×). C. Higher magnification of tail of control embryo (10×). D. Higher magnification of tail of G4 dendrimer-treated embryo (10×).

