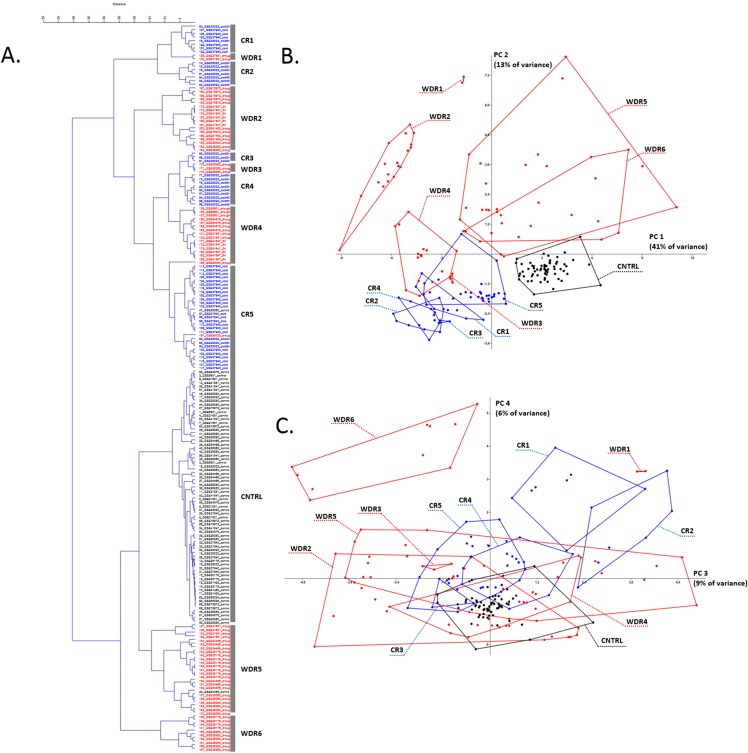
Figure 1. Transcriptome meta-analysis of data on stress-induced changes in the AOS rice genes.
The cluster analysis (A) and the principal component analysis (B and C) scatterplots are given. Next, to the component axes, the contribution of the component into all variance is indicated. The clusters are shown with broken stick and are marked with captions in the PCA scatterplots (CR is for cold response, WDR is for water deficiency response). The color of the dots reflects the nature of repetition (black is for control experiment, red is for water deficiency response, blue is for cold response).

